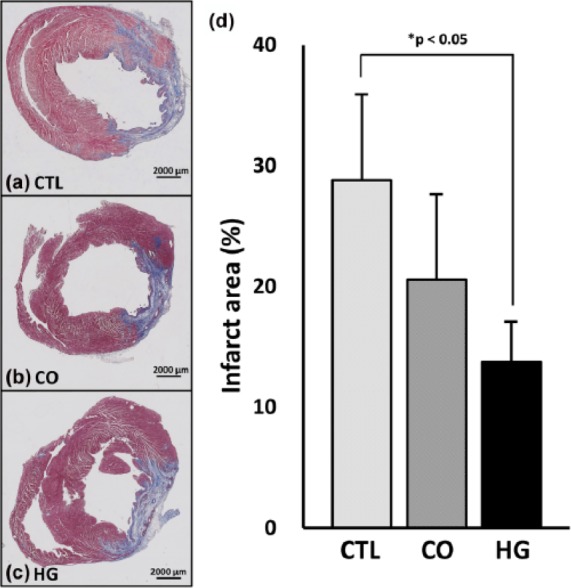
Figure 2.

Infarct area. (a–c) Representative images of Masson’s trichrome–stained sections at 4 weeks after treatment (bar = 2000 µm). (d) Area analysis of infarction size (n = 5, each) demonstrated that there was no significant difference between the control (CTL) and cells only (CO) groups. In contrast, the cells in hydrogel (HG) group showed a significantly smaller infarct size than the CTL group (p < 0.05), although there was no significant difference compared to the CO group (p = 0.09).
