Figure 3.

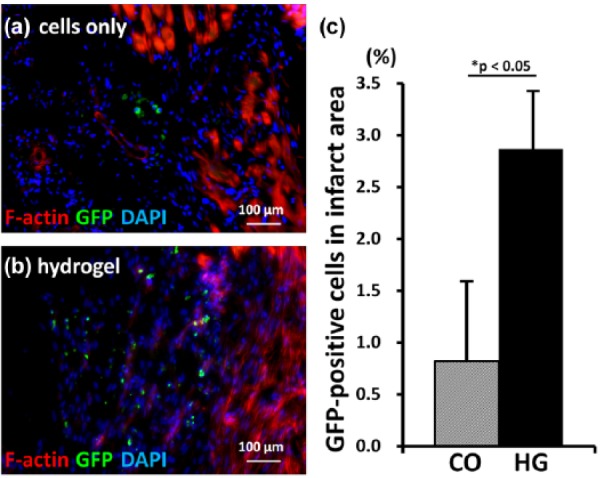
Injected cell retention. (a and b) Images of heart sections at 1 week after cell injection are shown (400×). In the peri-infarct area, actin fibers were deformed due to myocardial infarction (left side). More injected (GFP-positive) cells were observed in the hearts of the cells in hydrogel (HG) group rats than in those of the cells only (CO) group rats (bar = 100 µm). (c) Semi-quantitative analysis demonstrated that the number of GFP-positive cells in the infarct area was 2.8-fold higher in the HG group than in the CO group (n = 5).
