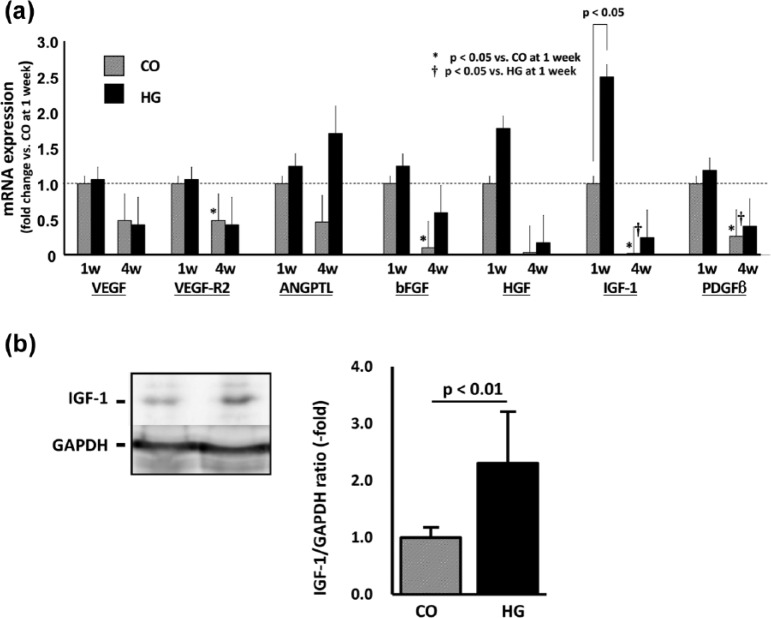
Figure 4.
Cytokine expression. (a) The expression of cytokines mRNA in the peri-infarct area was measured at 1 and 4 weeks after treatment and is shown as the fold change based on the expression in the cells only (CO) at 1 week. Only IGF-1 showed a significant increase (2.5-fold; p < 0.05, n = 5). At 4 week, the expressions of VEGF-R2 and bFGF in CO and IGF-1 and PDGF-β2 in both CO and HG were significantly less compared to that at 1 week (p < 0.05, respectively, n = 5 each). (b) The expression of IGF-1 protein at 1 week was also significantly higher in HG group compared to that in CO group (2.3-fold; p < 0.01, n = 6 each).

