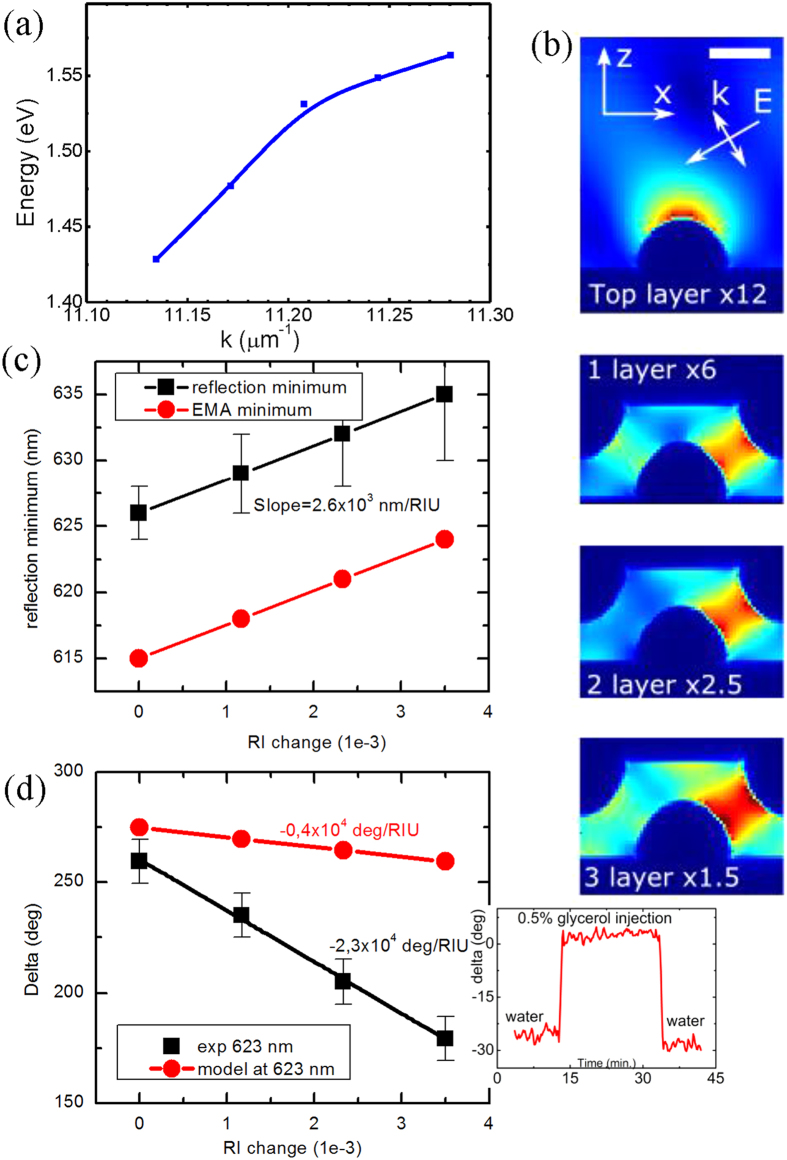
Figure 3. Properties of resonances in 3D Woodpile photonic crystal arrays, assessment of sensitivity in biosensing.
(a) Dispersion curve constructed on the basis of experimental data (combinations of the resonance angle of incidence and wavelength). (b) Distribution of electric field inside the metamaterials structure obtained from FDTD simulations; Calibration curves for spectral (c) and phase (d) responses as a function of refractive index change caused by the addition of different glycerol concentrations. Experimental and theoretical data are presented by black and red lines, respectively. The inset shows a typical shift of phase Δ when 0.5% of glycerol is added to buffer water solution pumped through the metamaterial structure.

