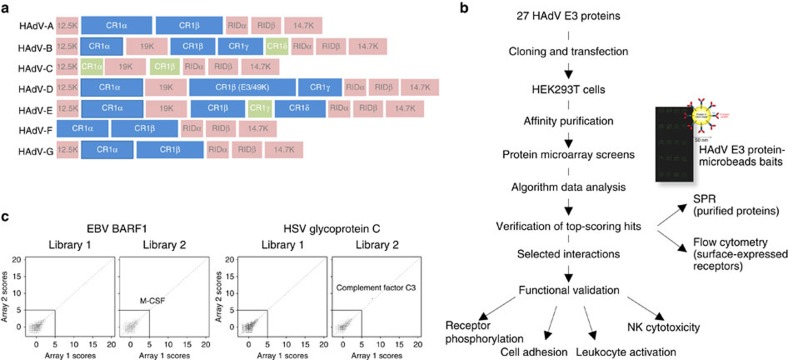
Figure 1. HAdVs as a model to study the extracellular interactome.
(a) Schematic of the E3 transcription unit for each HAdV species, adapted with permission obtained from Elsevier Ltd60. Genes showing higher relative conservation are represented by pink boxes, whereas green colour indicates species-specific genes predicted to encode for intracellular products. Blue boxes represent divergent genes predicted to encode for extracellular proteins included in this study. (b) Summary of the workflow for the discovery of the HAdV-host extracellular interaction network. (c) Intersection plots representing screen results obtained for proof-of-concept assays. Each viral protein was screened against two extracellular human protein libraries, representing 1,555 genes. Each scatter plot represents two replicate microarray data sets (Array 1 and Array 2), where dots represent average scores for each protein in the library. The lower left square in each plot represents an empirically set cutoff of 5 and contains all non-hit proteins. The data analysis and scoring procedures are described in the ‘Methods’ section. M-CSF was identified as a hit for EBV BARF1 (left plot), whereas HSV glycoprotein C targeted the complement factor C3 (right plot).

