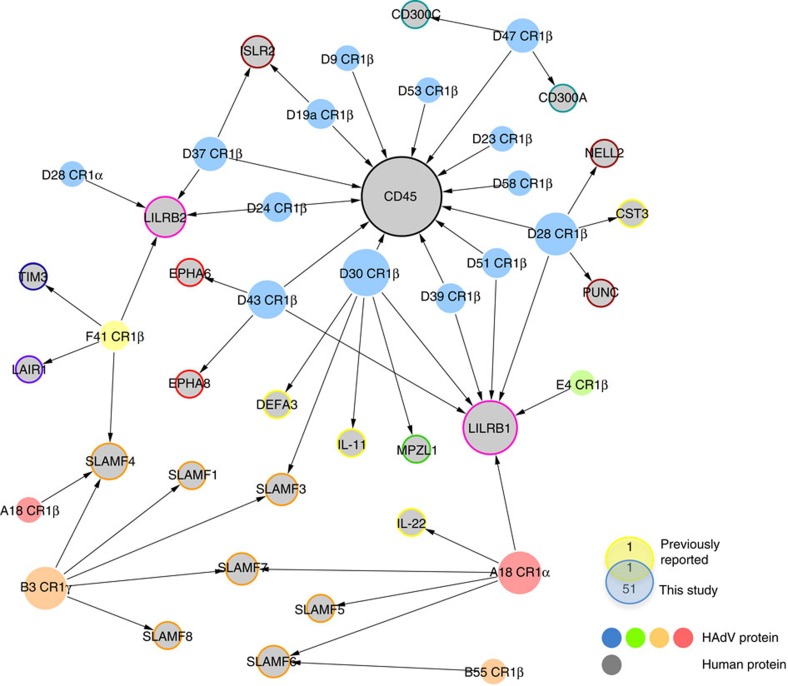
Figure 2. HAdV E3 protein extracellular immunomodulatory interaction network.
Network plot representing the new 51 virus–host interactions identified and experimentally validated from over 30,000 pairs analysed. Coloured filled nodes indicate HAdV species. Grey nodes represent host proteins grouped into different categories (orange, SLAMFs; pink, LIL; brown, nervous factors; red, ephrin receptors; cyan, CD300 family; yellow, secreted factors; green, MPLZ1; blue, TIM3 and purple, LAIR1). Node size reflects the number of interactions identified for each protein. Plot was generated using Cytoscape software. Diagram shows overlap between our network and previously characterized E3 protein–host factor extracellular interactions16.

