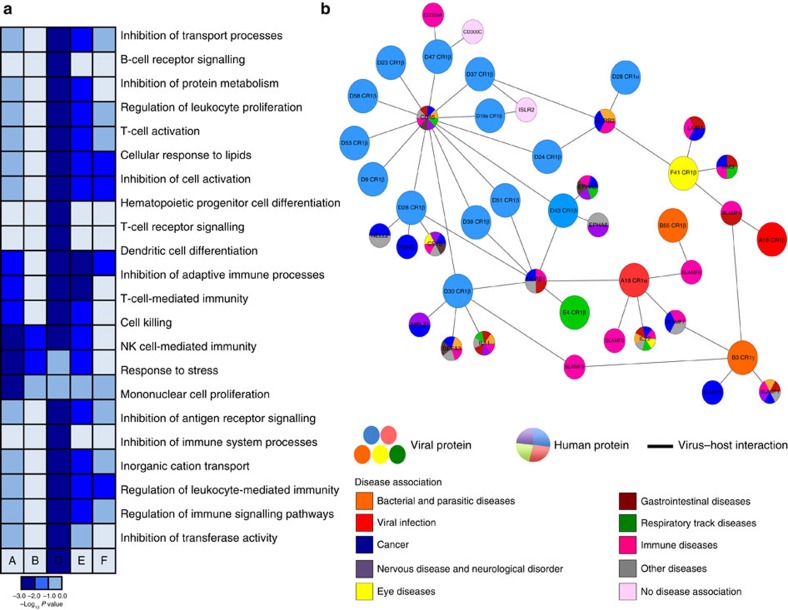
Figure 6. Gene ontology and disease association for the HAdV extracellular network.
(a) Heat map depicting manually curated enriched biological processes of the host factors targeted by the HAdV E3 proteins obtained by a GO term analysis. Host genes were split by the viral species with which they interacted. These lists were separately queried for GO enrichment. The values represent the −log10 P value of the enrichment, indicated by different colours as shown in the accompanying scale. Grey colour denotes absence of genes in a particular GO category. (b) Overlaid of the E3 protein–host interaction network with disease-associated host proteins. HAdV E3 proteins are shown as colour nodes, edges indicate the virus–host interactions identified and pie charts represent the targeted host factors, which were coloured according to the association of each protein with disease. Disease terms from the DisGeNET database22 were manually collapsed to create curated terms for the extracellular HAdV network (colours are specified in the legend).

