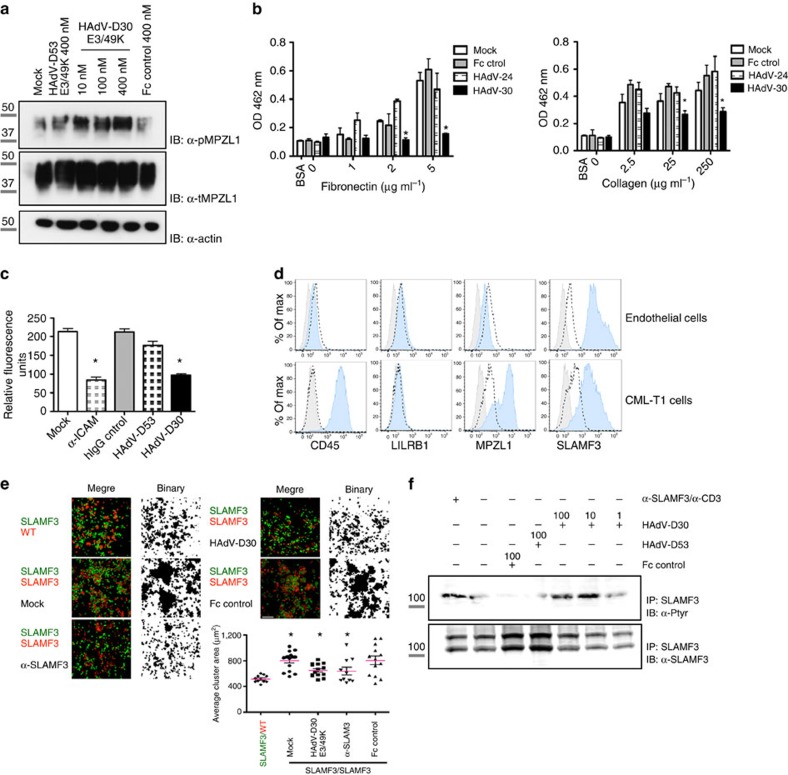
Figure 7. HAdV-D30 E3/49K modulates cell adhesion through MPZL1 and SLAMF3 targeting.
(a) HeLa cells were stimulated with the indicated proteins (200 nM) and MPZL1 activation was analysed using an anti phospho-MPZL1 antibody. Full immunoblot is shown in Supplementary Fig. 8g. (b) HeLa cells were pre-stimulated with the MPLZ1 binder HAdV-D30 E3/49K or control proteins and incubated with (left) FN- or (right) collagen-coated plates and adhered cells were quantified. HAdV-D30 E3/49K blocks HeLa cell adhesion (*P<0.01, *P<0.001 and *P<0.05; *P<0.001, respectively, (analysis of variance)). Plot shows one representative experiment out of at least three independent assays run in triplicates. Mean±s.d. (c) Analysis of CML-T1 T cell adhesion to HUVEC endothelial cells. T cells were labelled with Calcein AM and incubated with the HUVEC monolayers during 30 min, after pre-incubation with the indicated proteins (100 nM). Cell adhesion was quantified using a fluorescence plate reader. Mean±s.d., triplicate data points from two to three independent experiments. HAdV-D30 E3/49K decreases T-cell adhesion to HUVEC cells (Students t-test, *P=0.0004 and *P=0.002, respectively). Scale bars=20 μm. (d) Expression of HAdV-D30 E3/49K identified receptors on the surface of HUVEC and CML-T1 cells. Grey-filled histograms represent unlabelled cells, dashed histograms show isotype antibody binding and blue histograms represent surface expression of the indicated molecules. (e) CHO cells transfected with SLAMF3 were stained with green or red dyes and co-incubated after pre-incubation with the indicated proteins. Cell cluster formation was monitored using a confocal microscope. Plot shows the quantification of one representative assay. HAdV-D30 E3/49K competes SLAMF3-mediated cell clustering (Students t-test, *P=0.0031, *P=0.035 and *P=0.025, respectively). Scale bar, 150 μm. (f) SLAMF3 activation was analysed in receptor immunoprecipitates. Assays are representative of at least two independent experiments. Molecular sizes are indicated in kDa. Full immunoblot is shown in Supplementary Fig. 8h.

