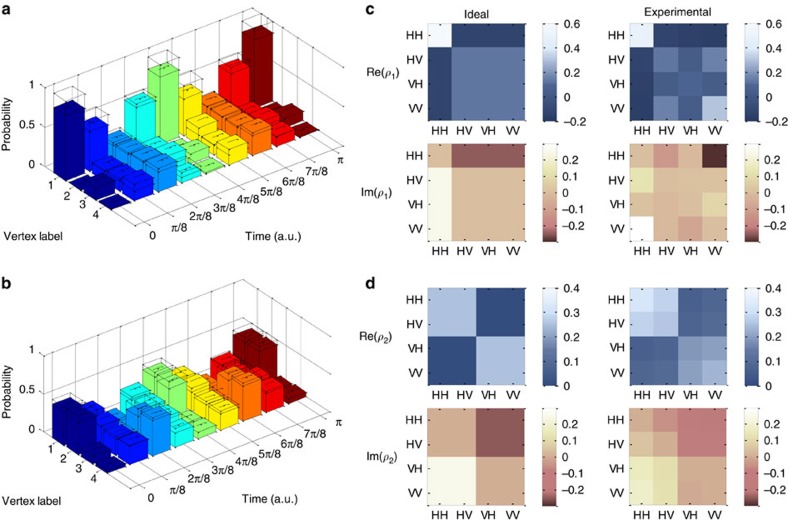
Figure 3. Experimental results for simulating CTQWs on K4.
(a,b) The experimental sampled probability distributions with ideal theoretical distributions overlaid, for CTQWs on K4 graph with initial states  and
and  . The s.d. of each individual probability is also plotted, which is calculated by propagating error assuming Poissonian statistics. (c,d) The ideal theoretical and experimentally reconstructed density matrices for the states
  (corresponding to ρ1) and
  (corresponding to ρ2). Both of the real and imaginary parts of the density matrices are obtained through the maximum likelihood estimation technique, and is shown as Re(ρ) and Im(ρ), respectively. Further results are shown in Supplementary Table 1, Supplementary Fig. 2 and Supplementary Note 4.

