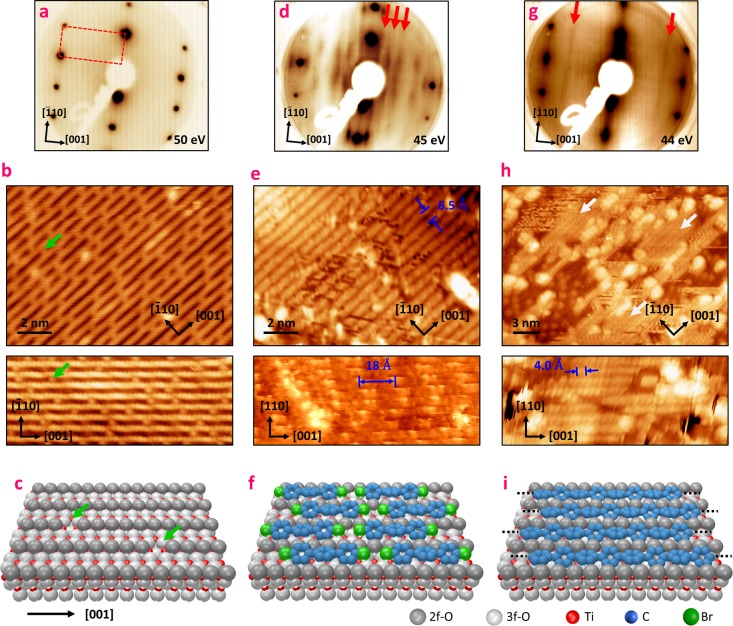
Figure 1.
Structural characterization of supramolecular and polymeric phases. LEED patterns (a, d, g), room temperature STM images (b, e, h), and ball models (c, f, i) associated with the clean rutile-TiO2(110) substrate (a–c), the supramolecular layer (d–f), and the polymeric layer (g–i). (d) and (e) were measured after saturation of the surface with DBTP deposited at room temperature, (g) was measured after saturation with the substrate held at 575 K, and (h) was measured after semisaturation with the surface held at 575 K. For clarity, hydrogen atoms have been omitted in the ball models. In (b) and (c), green arrows indicate some oxygen vacancies. The white arrows in (h) indicate the polymeric chains.

