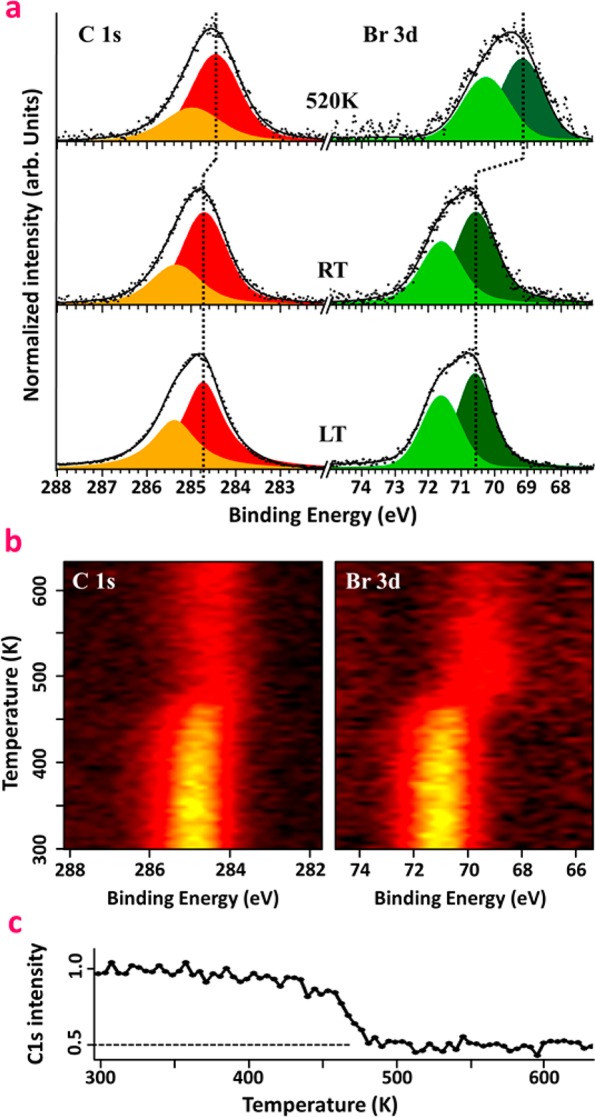
Figure 2.

X-ray photoemission spectroscopy: (a) C 1s and Br 3d core level spectra measured after a multilayer deposition of DBTP with the sample kept at 80 K (bottom), after 1 ML deposition at RT (middle), and after 1 ML deposition at 520 K (top); (b) evolution of C 1s and Br 3d core levels as a function of temperature, measured after deposition of 1 ML at RT; (c) evolution of the integrated C 1s signal as a function of temperature, extracted from (b).
