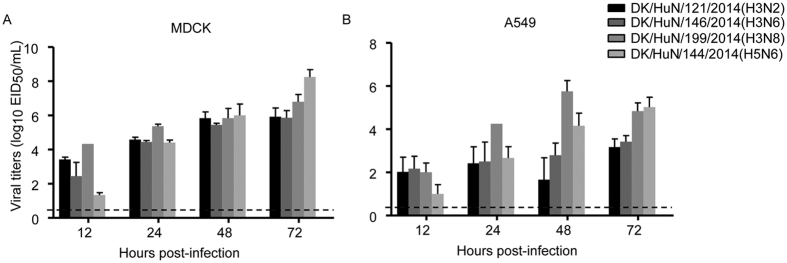
Figure 3. Replication curves of H3N2, H3N6, H3N8, and H5N6 viruses in mammalian cells.
MDCK and A549 cells were inoculated with the virus (104 EID50) and supernatants were collected for titration. (A) Viral growth curves in MDCK cells. (B) Viral growth curves in A549 cells. Data shown are viral titers (log10 EID50/mL) and the dashed lines indicate lower limits of detection.

