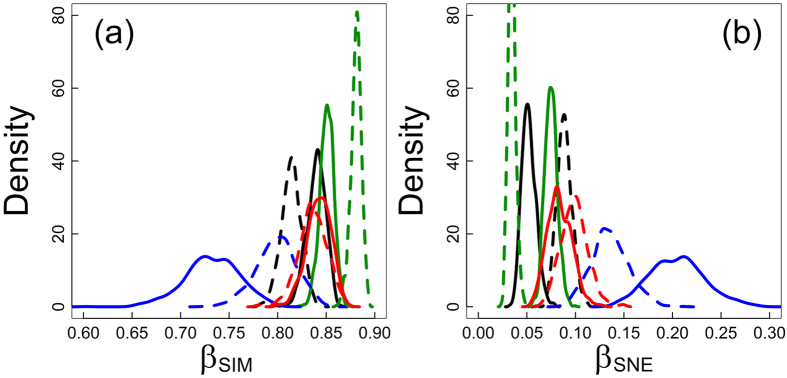
Figure 4. Density plots representing (a) the distribution of the turnover (β SIM) and (b) nestedness-resultant multiple-site dissimilarity (β SNE) across 1000 samples of 50 pixels.
Components of multiple-site dissimilarity were computed for potential species composition in mosses (red), liverworts (blue), ferns (black) and spermatophytes (green) in northern (latitude above 46th parallel, solid line) and southern Europe (latitude below 46th parallel, dashed line).

