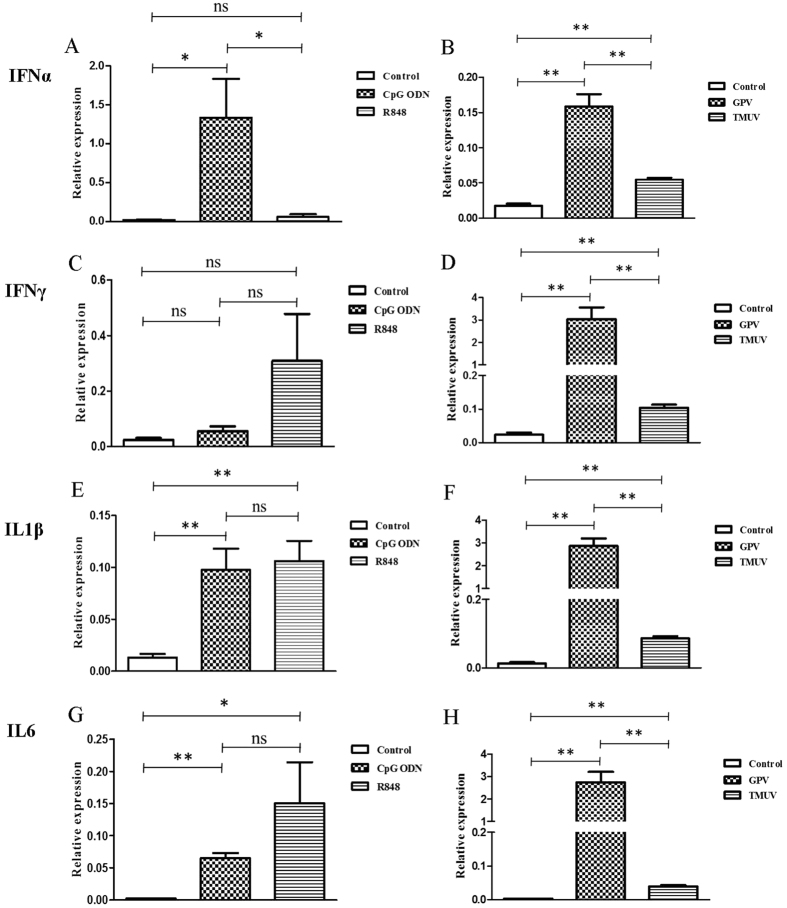
Figure 4. Relative transcriptional levels in goose PBMCs at 6 hours after stimulation with R848, CpGODN, GPV and TMUV.
IFNα, IFNγ, IL1β, and IL6 mRNA expression levels were normalized to internal control. Data indicated are expressed as the mean ± SEM (n = 4). Groups marked by one star (*) presented a significant difference at P < 0.05; groups marked by two stars (**) presented a significant difference at P < 0.01. The data is the representative of three independent experiments.

