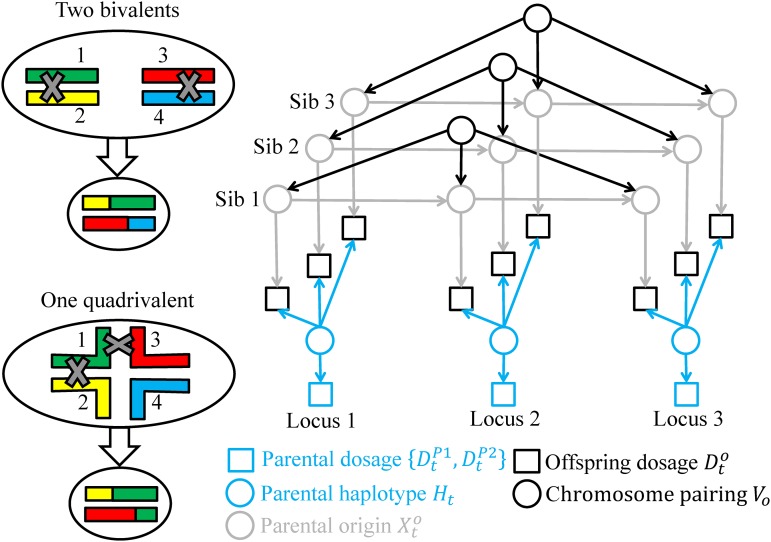
Figure 1.
The network model. Left panels refer to the possible gametes produced by either bivalent pairing or quadrivalent pairing in parent P1, where the four homologous/homeologous chromosomes are labeled by different colors. The right panel refers to the directed acyclic graph of the model for No = 3 offspring at Nt = 3 marker loci, where the rectangles denote known dosage data, the circles random variables, and the solid arrows probabilistic relationships described in the Methods section. Conditional on the chromosome pairings , the network model becomes a HMM along the chromosomes with the latent variables being the parental haplotypes and the parental origins .

