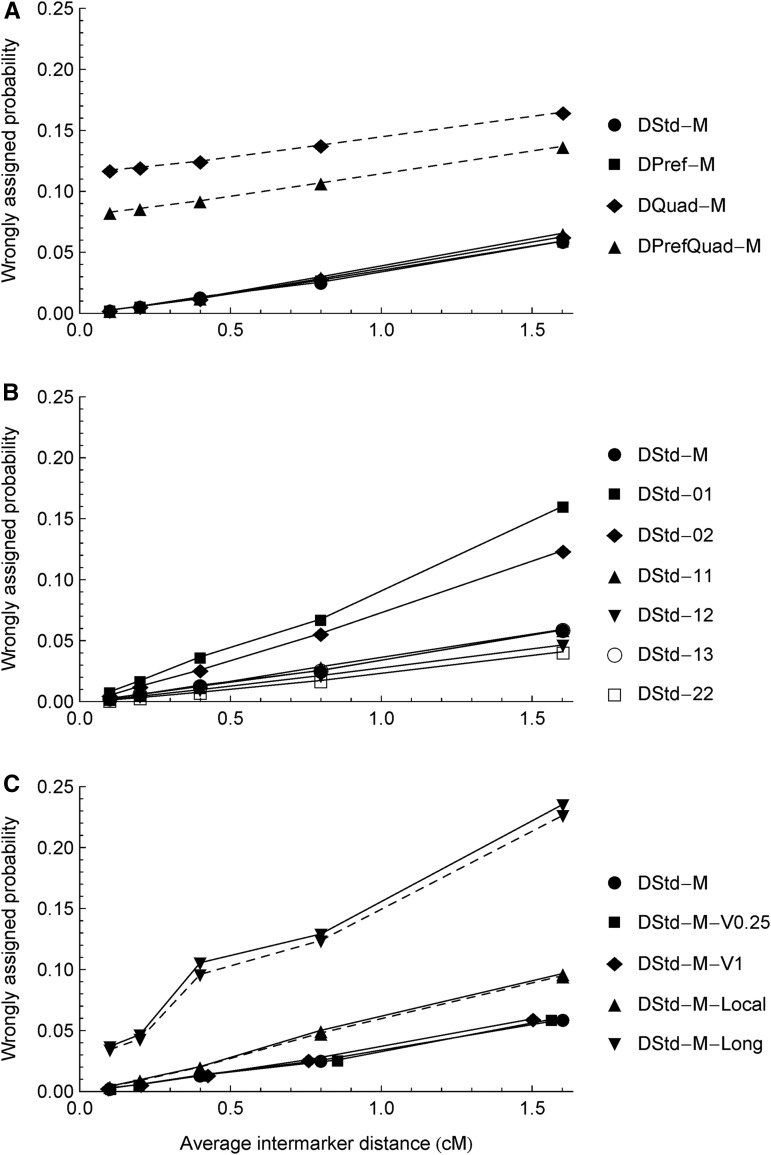
Figure 2.
Density dependencies of ancestral inference for the three types of the 14 simulation scenarios (Table 1). The y-axis is the wrongly assigned probability, one minus the posterior probability of being the true ancestral state, averaged over the No = 200 offspring and all markers. The increasing intermarker distances correspond to the numbers of markers NT = 1200, 600, 300, 150, and 75 on a 120-cM chromosome, respectively. The symbols connected by the solid lines denote the results obtained from the fullModel and the dashed lines from the bvModel. Except for DQuad-M, DPrefQuad-M, DStd-M-Local, and DStd-M-Long, the results from the bvModel and the fullModel are the same because all the offspring are identified as being produced only by bivalent pairing in the fullModel. In B, the results for DStd-11 and DStd-13 largely overlap with those for DStd-M.

