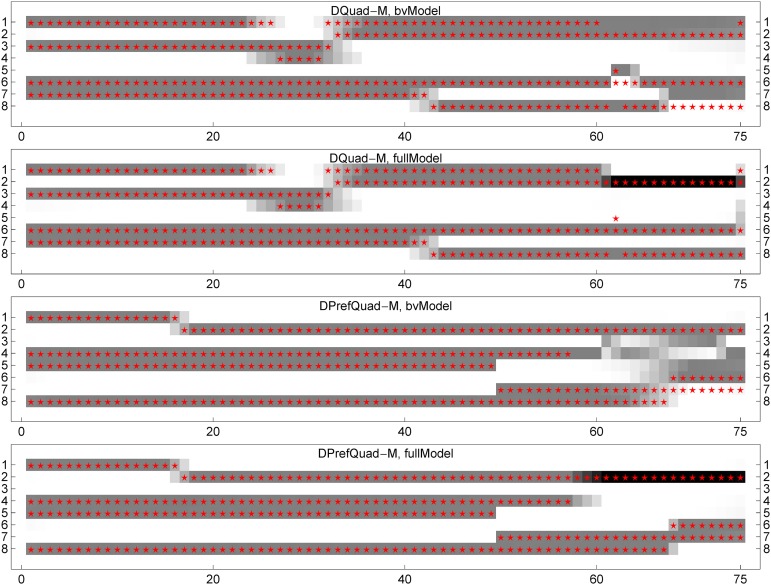
Figure 4.
The posterior haplotype probabilities for two typical offspring. The top two panels show the results obtained from DQuad-M using the bvModel and the fullModel, respectively; the bottom two panels, for the offspring from DPrefQuad-M. The x-axis refers to the Nt = 75 SNP markers, and the y-axis refers to the eight parental chromosomal origins of two parents. The red stars denote the true ancestral origins, and the gray levels denote the haplotype probabilities, with white = 0 and black =0.5; the haplotype probabilities at each marker sum to 1. The black bands indicate the double reduction where two copies of alleles have the same parental origin.

