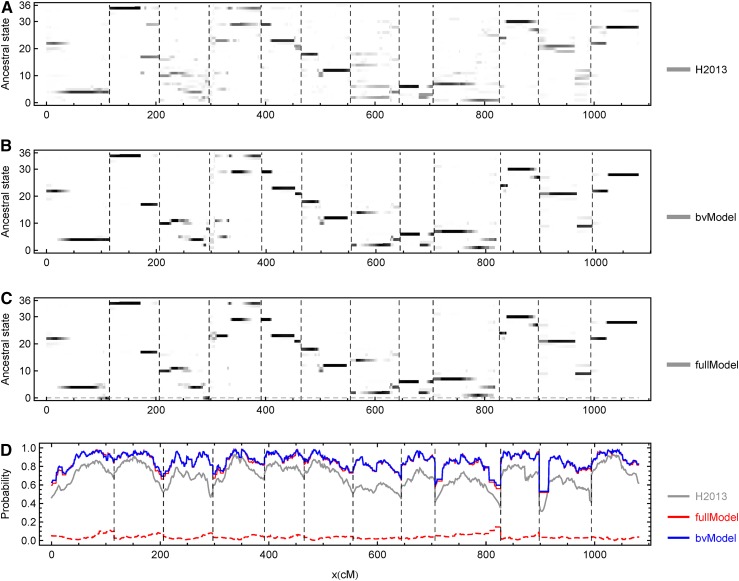
Figure 6.
Evaluation of ancestral inference along each chromosome obtained from the real potato data set. The dashed vertical lines indicate the chromosomal boundaries. (A–C) The posterior genotype probabilities for an offspring obtained from H2013, TetraOrigin (bvModel), and TetraOrigin (fullModel), respectively. The probabilities are represented by the gray levels, with white = 0 and black = 1. The dashed horizontal line in C denotes the collapsed genotypes with double reduction in the fullModel. (D) The maximum posterior probabilities averaged over the 190 offspring. The gray, blue, and red lines refer to the results obtained from H2013, TetraOrigin (bvModel), and TetraOrigin (fullModel), respectively; the results from the bvModel and fullModel overlap. The red dashed line denotes the estimated double-reduction probabilities by the fullModel.

