Figure 3.
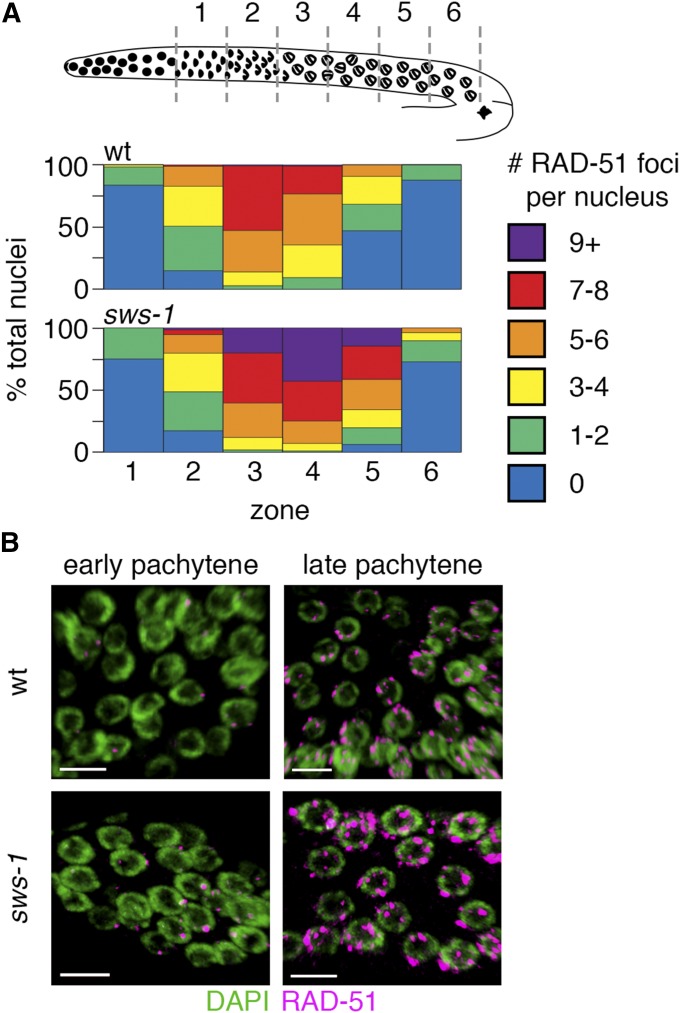
sws-1 alters meiotic RAD-51 dynamics. (A) Quantitative analysis of RAD-51 foci during meiotic prophase. Diagram depicts organization of the hermaphrodite germline with meiotic prophase prior to diplotene divided into six equal-sized zones (gray dashed lines) based on physical distance. The heatmap shows the percentage of total nuclei per zone with the indicated number of RAD-51 foci from wild type (wt) (top) and sws-1 (bottom) germlines (for color code, see legend). (B) Representative images of early and late pachytene nuclei in wt (top) and sws-1 (bottom) showing higher levels of RAD-51 foci (magenta) on DNA (green). Bar, 5 μm.

