Figure 7.
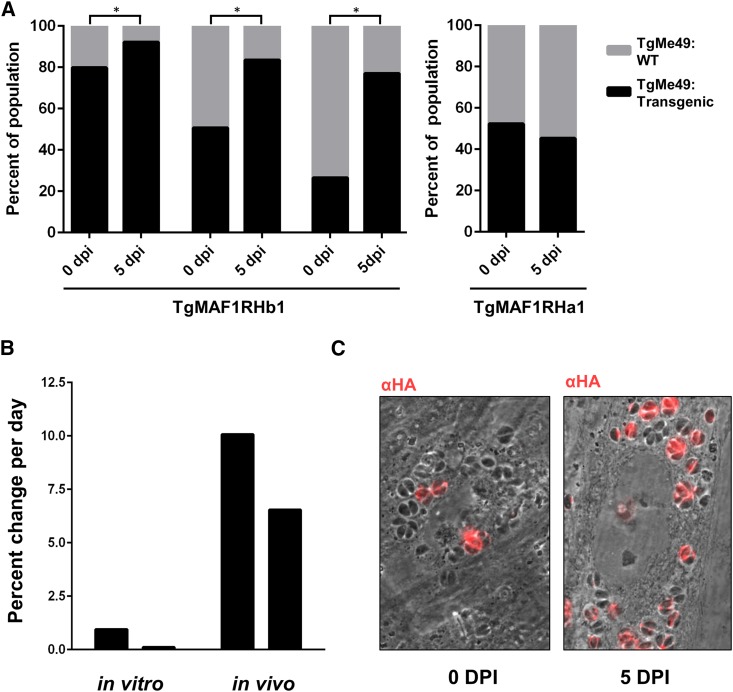
Expression of TgMAF1RHb1, but not TgMAF1RHa1, in type II T. gondii increases competitive advantage. (A) Mice were infected with mixed populations of TgME49:EV and TgME49:MAF1 with the indicated isoforms and ratios. Infection was allowed to progress for 5 days and population proportions before and after infection were quantified by IFA. Both HMA+ and HMA− MAF1 isoforms were assessed. TgME49:TgMAF1RHb1 significantly increases in proportion to TgME49:EV. *χ2 P-value <0.05. The proportion of TgMAF1RHa1-expressing parasites did not increase during the infection. (B) Percent change per day was calculated for the populations that started with 4:1 TgME49:EV to TgME49:TgMAF1RHb1 both in vitro and in vivo by dividing the total percent increase of TgMAF1RHb expressing parasites within the population by the number of days of infection. The first bar of both the in vitro and in vivo infections represent one clone set, while the second bar for each represents a second clone set. (C) Representative images of a mixed population from A before and after a 5-day in vivo infection. HA staining indicates TgMAF1RHb1-positive vacuoles.

