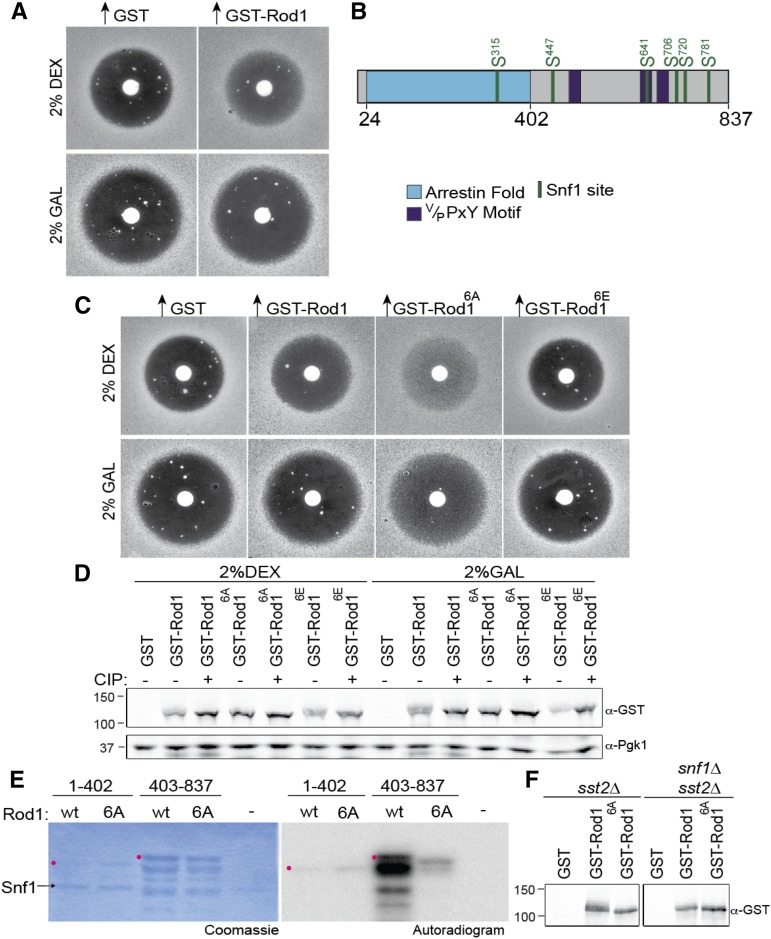
Figure 1.
Snf1 phosphorylates Rod1 in vivo and in vitro. (A) MATa sst2∆ cells (JT6674) harboring the GEV chimera and a URA3-marked high-copy-number (2 µm DNA) plasmid expressing GST-Rod1 under GAL promoter control were grown in minimal medium (SC-Ura) with either 2% dextrose (top) or 2% galactose (bottom) as the carbon source, induced with β-estradiol as described in Materials and Methods, plated in top agar on the same medium, exposed to a filter disk containing 15 µg of α-factor, and incubated for 4 days at 30°. (B) Schematic diagram of Rod1. Arrestin fold (blue); Rsp5-binding motifs (purple); six Snf1 consensus motifs (green). (C) Same as in A, with inclusion of a nonphosphorylatable allele (Rod16A) and phospho-mimetic allele (Rod16E). (D) Samples of the cultures used in C were harvested and lysed, and the resulting extracts were divided and not treated (−) or treated (+), as indicated, with CIP, resolved by SDS-PAGE, and analyzed by immunoblotting with anti-GST or with anti-Pgk1 (loading control) antibodies. (E) GST fusions to the arrestin fold domain (residues 1–402) and the remaining C-terminal region (402–837) of either wild type (wt) or the 6A allele of Rod1 were purified from E. coli and incubated with [γ-32P]ATP and purified Snf1, and the resulting products were resolved by SDS-PAGE and analyzed by autoradiography. Position of the indicated full-length GST fragment (red dot). (F) GST alone, GST-Rod1, or GST-Rod16A, as indicated, were expressed in either SNF1+ sst2∆ cells (left) or snf1∆ sst2∆ cells (right) and then analyzed by SDS-PAGE.

