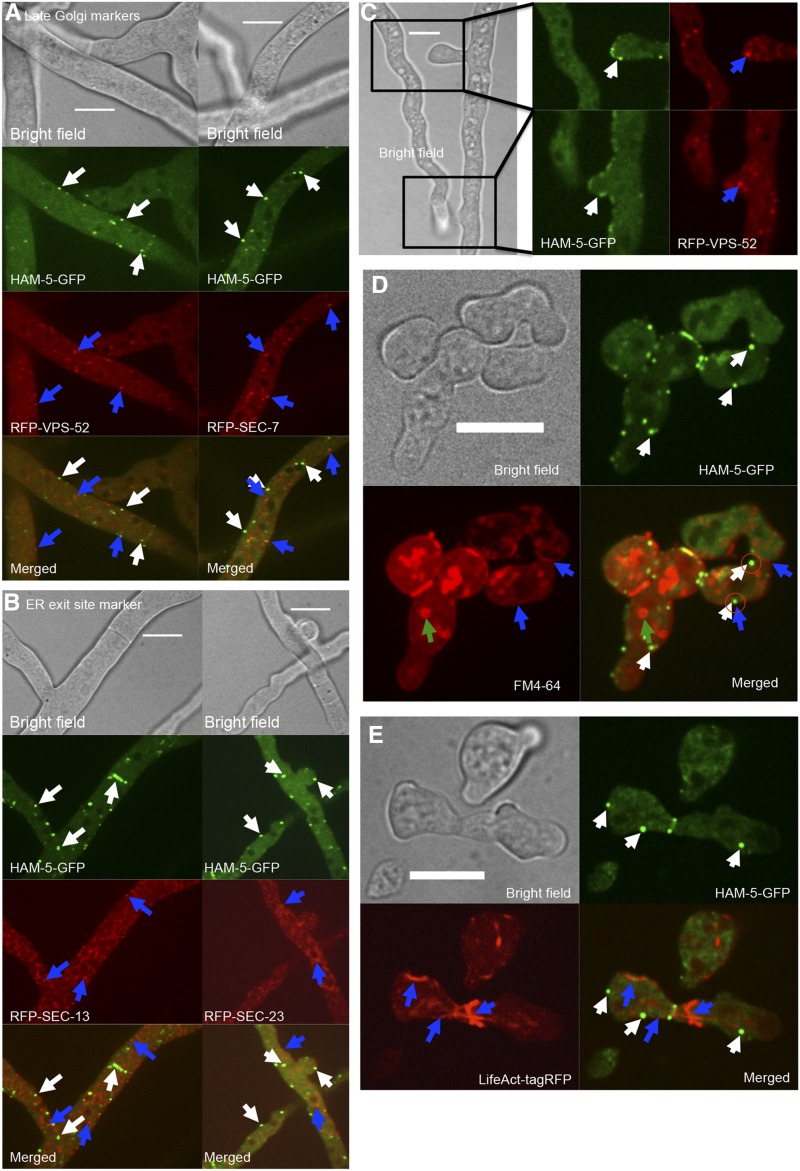
Figure 2.
HAM-5–GFP fusion puncta do not colocalize with late Golgi, ER-exit sites, FM4-64 stained endosomes, or with actin filaments. (A) Cellular localization in heterokaryotic strains expressing HAM-5–GFP (his-3::ham-5-gfp) and RFP-tagged marker proteins VSP-52 (his-3::rfp-vps-52) or SEC-7 (his-3::rfp-sec-7) (Table S1). Top shows bright field image, the second panel shows GFP fluorescence, the third panel shows RFP fluorescence, and bottom shows the merged images. White arrows point to HAM-5–GFP puncta. Blue arrows point to RFP-VPS-52 or RFP–SEC-7 structures. Bar, 10 µm. (B) Heterokaryotic strains expressing HAM-5–GFP (his-3::ham-5-gfp) and RFP-tagged marker proteins SEC-13 (his-3::rfp-sec-13) and SEC-23 (his-3::rfp-sec-23) (Table S1). Top shows bright field image, the second panel shows GFP fluorescence, the third panel shows RFP fluorescence, and bottom shows merged images. White arrows point to HAM-5–GFP puncta. Blue arrows point to RFP–SEC-13 or RFP–SEC-23 structures. Bar, 10 µm. (C) Localization in the homing tips of heterokaryotic HAM-5–GFP (his-3::ham-5-gfp) and VSP-52 (his-3::rfp-vps-52) hyphae. Left shows bright field image, magnified panels show GFP fluorescent image (middle), and RFP fluorescent images (right) of two hyphal tips undergoing homing and fusion. White arrows point to HAM-5–GFP puncta at the tip. Blue arrows point to RFP–VPS-52 structures. Bar, 10 µm. (D) Cellular localization of HAM-5–GFP vs. the membrane selective dye FM4-64 in his-3::ham-5-gfp germlings. Top left image is bright field, top right image shows GFP fluorescence, bottom left shows red fluorescence and bottom right is the merged image. White arrows point to HAM-5–GFP puncta, blue arrows point to the FM4-64-stained cell membrane, green arrows to internal FM4-64-stained vesicles, and encircled are HAM-5–GFP puncta that show localization to the cell periphery. Bar, 10 µm. (E) Cellular localization of HAM-5–GFP and Lifeact-TagRFP in the homokaryotic strain (his-3::ham-5-gfp; Ptef-1::Lifeact-TagRFP-T::nat1). Top left image is bright field, top right is GFP fluorescence image, bottom left is RFP fluorescence image, and bottom right is the merged image. White arrows point to HAM-5–GFP puncta, blue arrows points to the LifeAct-tagRFP-marked actin cables. Bar, 10 µm.

