Figure 3.
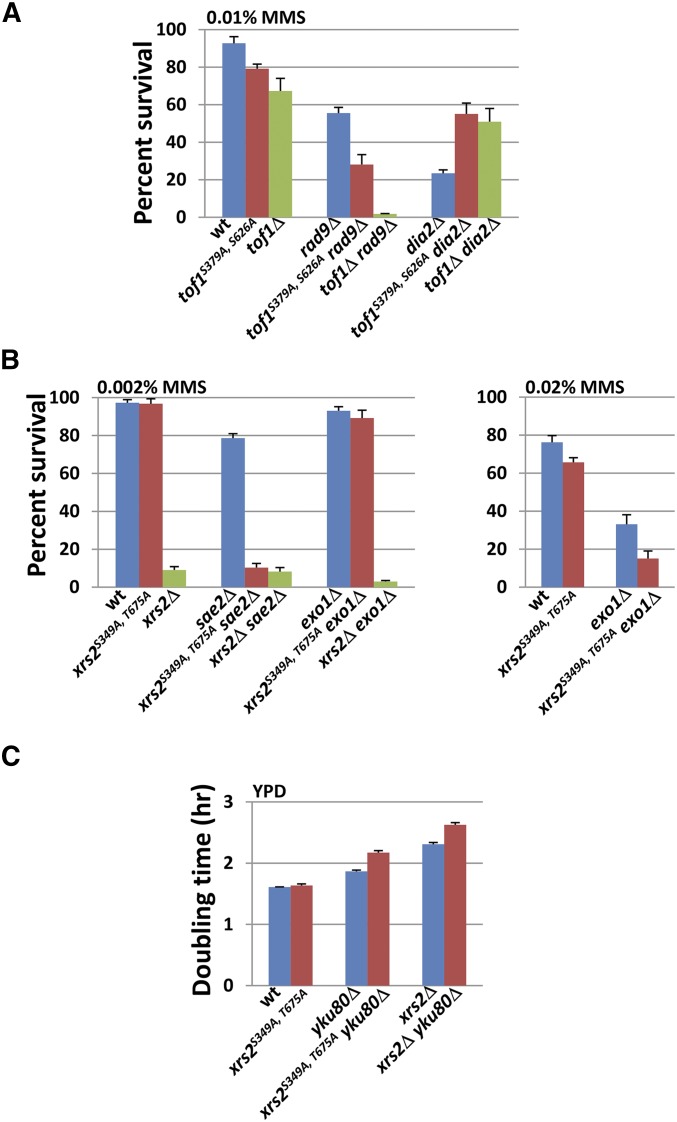
tof1S379A, S626A and xrs2S349A, T675A recapitulate a subset of the genetic interactions manifested by their respective deletion mutants. (A) tof1S379A, S626A shows negative interaction with rad9Δ and positive interaction with dia2Δ in the presence of MMS. The survival rates of wild-type and mutant strains in 0.01% MMS were determined as in Figure 2B. Three independent, PCR-confirmed gene knockout transformants of each strain were tested, and the error bars represent the standard deviation for the three isolates. [The tof1Δ rad9Δ strain is sml1Δ tof1Δ rad9Δ. The sml1Δ single mutation does not affect growth or survival at the tested MMS concentrations (data not shown)]. (B) xrs2S349A, T675A shows genetic interactions with sae2Δ and exo1Δ in the presence of MMS. The assay of survival rates of wild-type, single-, and double-mutant strains in indicated MMS concentrations were performed as in Figure 2B. Three independent, PCR-confirmed gene knockout transformants of each strain were tested, and the error bars represent the standard deviation for the three isolates. (C) xrs2S349A, T675A shows a synergistic growth interaction with yku80Δ. The wild type, xrs2S349A, T675A, and yku80Δ single- and double-mutant cells were grown in YPD to log phase at 30°. The cultures were diluted such that every culture started at a density of 106 cells/ml. The cell density of each culture was subsequently measured every 2 hr for 10 hr. The doubling time of each strain was calculated as in Figure 2A. Three independent, PCR-confirmed gene knockout transformants of each strain were tested, and the error bars represent the standard deviation for the three isolates.

