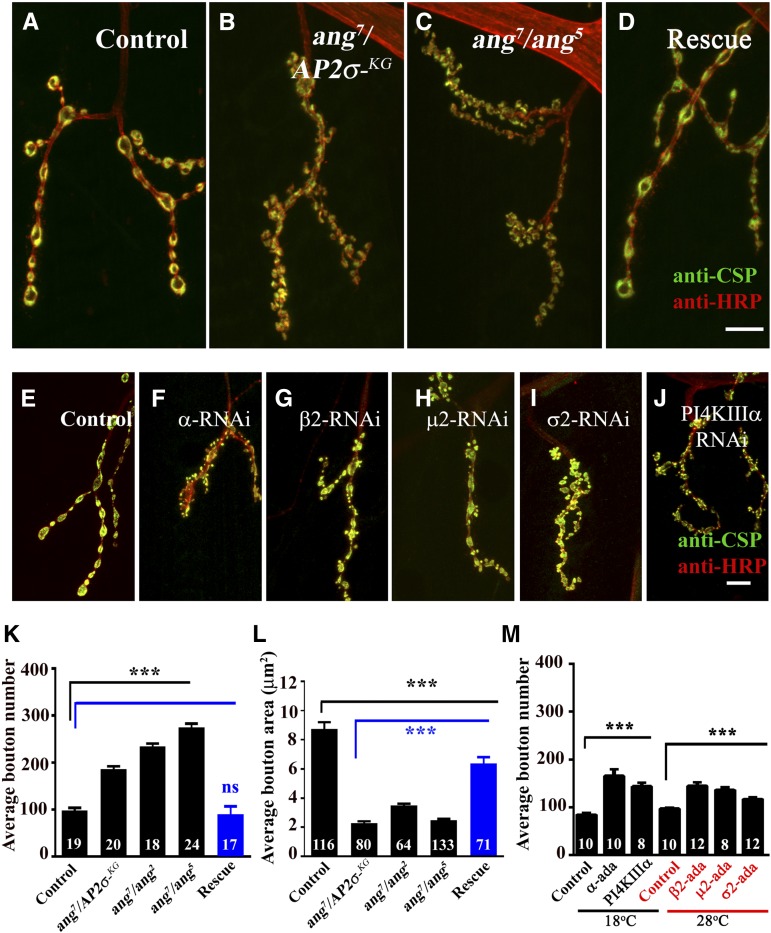
Figure 3.
Mutation in σ2-adaptin causes aberrant neuromuscular junction formation. (A–D) Confocal image of NMJ synapses at muscle 4 of (A) control animals, (B and C) heteroallelic σ2-adaptin mutants (angur7/AP2σKG02457 and angur7/angur5), and (D) transgene-rescued animal (actin5C/+; angur7/UAS-AP2σ, AP2σKG02457) double immunolabeled with a presynaptic marker CSP (green) and neuronal membrane marker HRP (red) to reveal the bouton outline. Compared to the control NMJ, the heteroallelic combination of σ2-adaptin shows severely altered NMJ morphology. Scale bar, 15 μm. (E–J) Confocal images of NMJ synapses at muscle 4 co-labeled with CSP (green) and HRP (red) of (E) control and (F–J) neuronally expressing RNAi against AP2 complex subunits or PI4KIIIα: (F) elavC155/+; α-adaptin RNAi/+, (G) elavC155/+; β2-adaptin RNAi/UAS-Dicer, (H) elavC155/+; μ2-adaptin RNAi/UAS-Dicer, (I) elavC155/+; σ2-adaptin RNAi/UAS-Dicer, and (J) elavC155/+; PIK4IIIαRNAi/+. Note that neuronal knockdown of any of the subunits of the AP2 complex or PIK4IIIα phenocopies σ2-adaptin mutations. Scale bar, 15 μm. (K) Histogram showing average number of boutons at muscles 6/7 of the A2 hemisegment in control animals (98.2 ± 4.8), heteroallelic σ2-adaptin mutants (angur7/AP2σKG02457: 185.4 ± 6; angur7/angur2: 233.4 ± 7; angur7/angur5: 274 ± 8.5) and the rescued animals (actin5C/+; angur7/UAS-AP2σ, AP2σKG02457: 89.9 ± 4.0). The numbers in columns represent the number of 6/7 NMJs of the A2 segment used for bouton quantification. ***P < 0.0001. Error bars represent standard error of the mean. Statistical analysis based on one-way ANOVA followed by post-hoc Tukey’s multiple-comparison test. (L) Histogram showing average bouton area in control animals (8.7 ± 0.5 μm2), heteroallelic σ2-adaptin mutants (angur7/AP2σKG02457: 2.3 ± 0.13 μm2; angur7/angur2: 3.5 ± 0.12 μm2; angur7/angur5: 2.5 ± 0.1 μm2) and rescued animals (actin5C/+; angur7/UAS-AP2σ, AP2σKG02457: 6.4 ± 0.4 μm2). The numbers in columns represent the number of boutons used for quantification. ***P < 0.0001. Error bars represent standard error of the mean. Statistical analysis based on one-way ANOVA followed by post-hoc Tukey’s multiple-comparison test. (M) Histogram showing quantification of average bouton numbers at muscles 6/7 of the A2 hemisegments of third instar larvae in control animals and neuronally expressing RNAi against AP2 subunits (control at 18°, 85 ± 3; control at 28°, 98 ± 2; α-adaptin, 167 ± 13; β2-adaptin, 145 ± 7.0; μ2-adaptin, 137 ± 5; σ2-adaptin, 118 ± 4) or PI4KIIIα (144 ± 7). At least 16 NMJ synapses of muscles 6/7 of the A2 hemisegment of each genotype were used for counting the number of boutons. ***P < 0.0001. The numbers in the columns represent the number of animals used for quantification. Error bars represent standard error of the mean. Statistical analysis based on one-way ANOVA followed by post-hoc Tukey’s multiple-comparison test.

