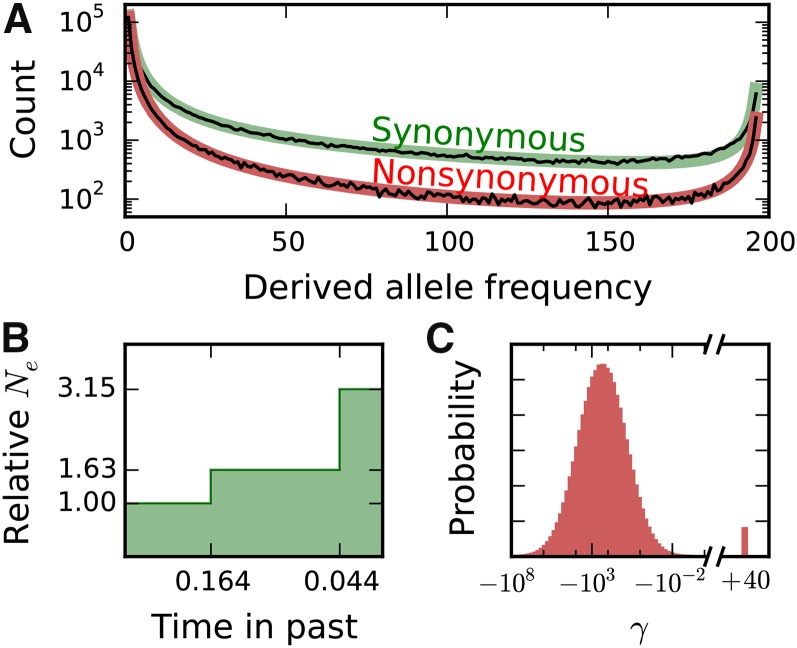
Figure 2.
Inferences of demographic history and marginal distribution of fitness effects from biallelic data. (A) Biallelic synonymous and nonsynonymous data (thin black lines) and corresponding maximum-likelihood model fits (thick colored lines). Ancestral state misidentification is likely responsible for most of the excess of high-frequency derived alleles, and a parameter to model such misidentification was included in both the synonymous and nonsynonymous models. (B) Inferred demographic model, with two instantaneous population size changes. Time is in units of generations, where is the ancestral effective population size. (C) Inferred distribution of fitness effects, lognormally distributed for negatively selected mutations with a proportion of positively selected mutations.

