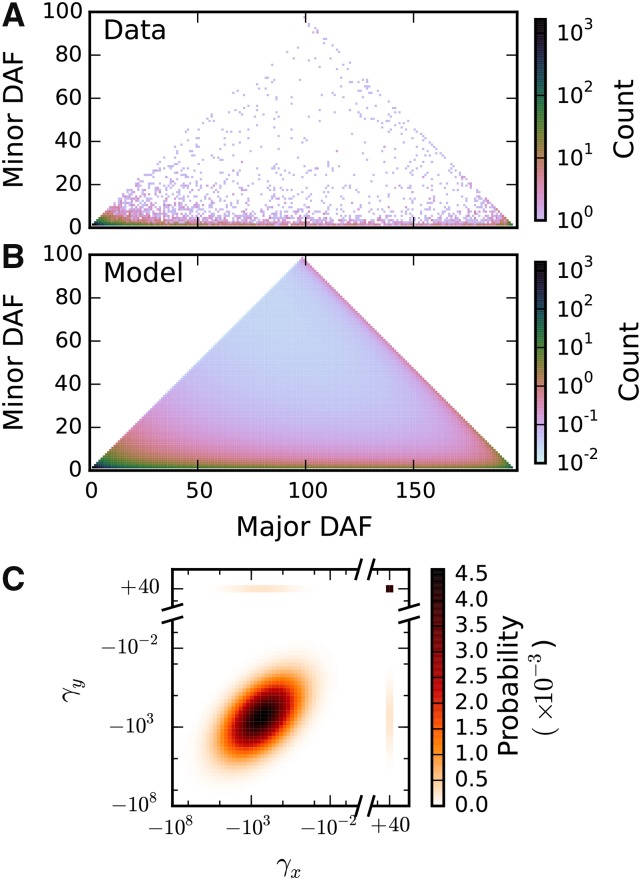
Figure 3.
Inference of selection correlation coefficient from triallelic data. (A) The observed triallelic frequency spectrum for mutually nonsynonymous triallelic sites, which contained 10,471 triallelic sites. (B) The best-fit model, optimizing the correlation coefficient ρ and the ancestral misidentification parameters. (C) Joint distribution of selection coefficients from the maximum-likelihood inferred correlation coefficient of Selection coefficients for nonsynonymous mutations at the same site are moderately correlated.

