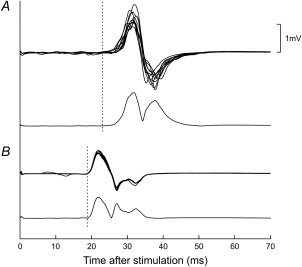
Figure 1.

Exemplary single‐subject cortical (A) and root (B) MEPs in APB. For each site of stimulation, 2 types of trace are shown: 10 superimposed raw sweeps (top) and an average of rectified sweeps (bottom). Latencies (dashed lines) were assigned using the average of the rectified sweeps.
