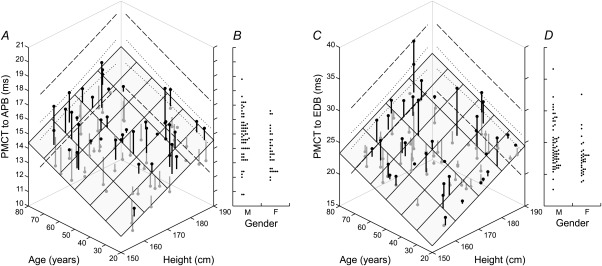
Figure 3.

Scatterplots of PMCT to APB and EDB against age and height (A, C), and dot plots of PMCT against gender (B, D). PMCT in both muscles was significantly related to age and height but not gender. The shaded plane shows the regression model (PMCT to APB = 0.0560 × age + 0.0881 × height − 3.28, r 2 = 0.432, P < 0.001; PMCT to EDB = 0.1214 × age + 0.2106 × height − 17.97, r 2 = 0.482, P < 0.001). Vertical lines indicate the residuals of individual data points above (black) and below the plane (gray). Examples of 95% confidence (dotted lines) and prediction intervals (dashed lines) are shown for the upper extremes of age and height.
