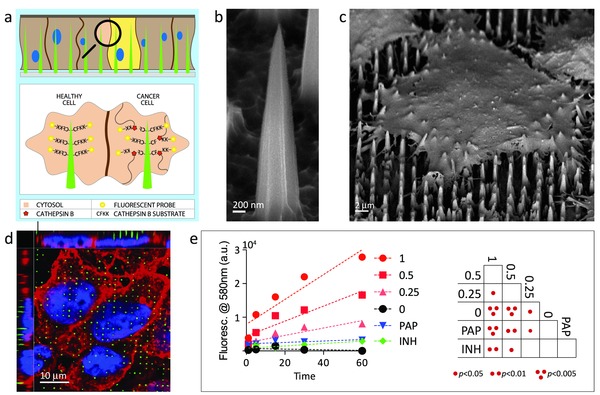
Figure 1.

The nanoneedle Cathepsin B sensor. a) Schematic diagram of sensor functionality when interfacing with cells. Nanoneedles interface the cytosol of cells where active CTSB cleaves its CFKK peptide substrate, releasing the linked TAMRA fluorescent probe in the cell cytosol. Higher CTSB activity corresponds to a higher cytosolic fluorescence. Scanning electron microscopy image of b) a nanoneedle and c) a cell seeded over a nanoneedle chip. d) Laser scanning confocal fluorescent microscopy image (LSC) showing nanoneedles interfacing with cells. Nanoneedles in green, cell membrane in red, nucleus in blue. e) Quantification of fluorescence released in solution from nanoneedles exposed to different concentrations of CTSB. Red lines represent CTSB at the indicated concentration in U/mL. PAP represents papain at 1 U mL–1, INH represents 1 U mL–1 CTSB inhibited with 1 10–6 m CA‐074. Negative control is represented by 0. The double entry table reports statistical significance between all pairs.
