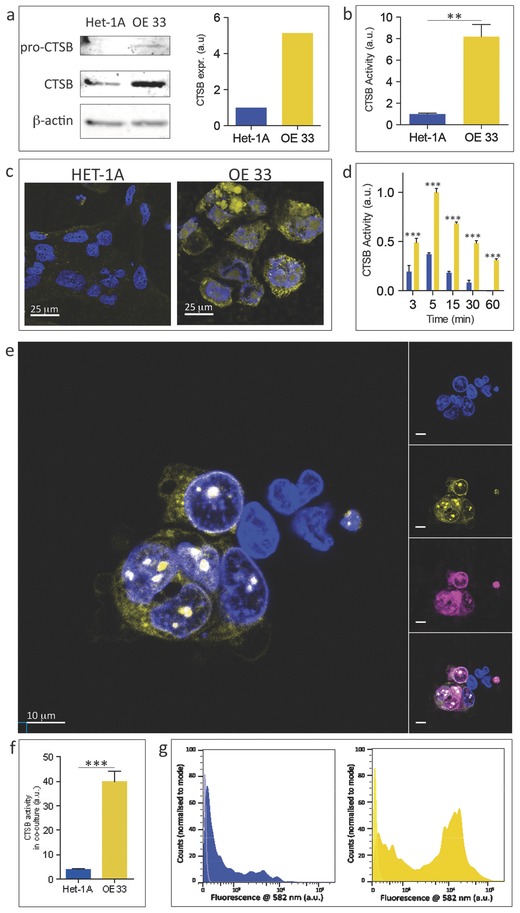
Figure 2.

Sensing CTSB activity in cells in culture. a) Sections of western blot membrane cut at the appropriate molecular weight for pro‐CTSB, CTSB and β‐actin showing their expression in HET‐1A and OE33 cells with relative band quantification. Sections are outlined in black. b) Quantification of CTSB activity in HET‐1A and OE33 cells by fluorogenic homogenous assay in cell lysates. c) Representative LSCs of HET‐1A and OE33 cells following application of the nanoneedle sensor for 15 min. Single z‐plane collected through the cytosol above the level of the nanoneedles. Cytosolic fluorescence originates from cleaved CTSB substrate (yellow). Nuclei stained in blue. d) Quantification of the area‐normalized fluorescence cytosolic signal for OE33 (yellow) and HET‐1A (blue) cells interfaced with nanoneedles. The horizontal axis represents interfacing time. e) Representative LSCs of HET‐1A and OE33 cells in coculture following application of the nanoneedles sensor for 15 min. Single z‐plane collected through the cytosol above the level of the nanoneedles. Cytosolic fluorescence originates from cleaved CTSB substrate. Nuclei stained in blue. Insets show separate signal for each fluorescent channel. OE33 cells are stained in magenta (CellVue). f) Quantification of the area‐normalized cytosolic signal for HET‐1A (blue) and OE33 (yellow) cells interfaced with nanoneedles in coculture. g) Intensity histogram for flow cytometric analysis of cytosolic fluorescence for gated HET‐1A (blue) and OE33 (yellow) cells interfaced with nanoneedles in coculture. **p < 0.01, ***p < 0.001.
