Figure 3.

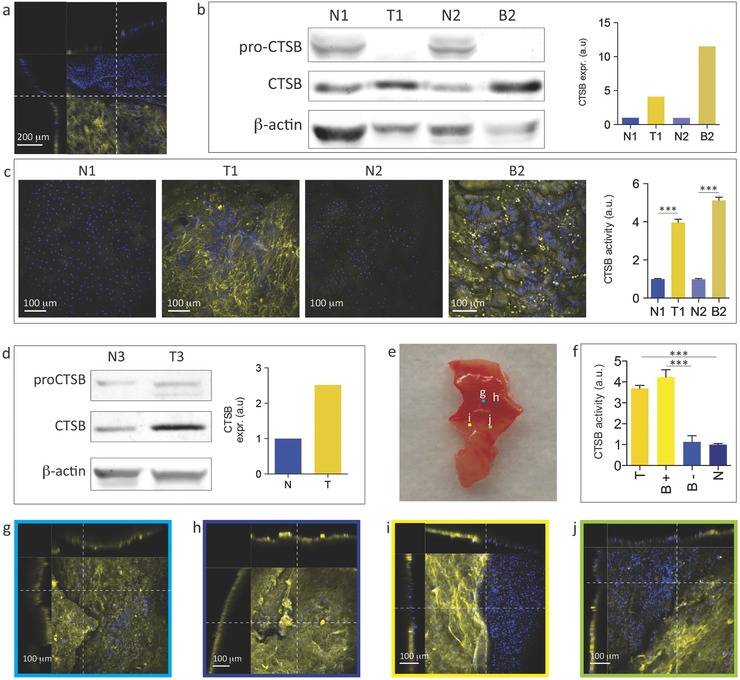
Sensing of CTSB activity in human esophageal tissue. a) LSCs of a human esophageal epithelium sample interfaced with the CTSB nanoneedle sensor for 15 min. The visible demarcation line between fluorescent and nonfluorescent cells originates from the edge of the chip. The side view shows a steep height profile within the tissue at the interfacing edge. b) Sections of western blot membrane cut at the appropriate molecular weight for pro‐CTSB, CTSB and β‐actin showing protein expression with quantification for matching normal (N1 and N2) and diseased (Tumour T1, Barrett's Dysplasia B2) region of tissues from patient 1 (N1, T1) and patient 2 (N2, B2), respectively. Sections are outlined in black. c) LSCs of the esophageal epithelium normal (N1, N2) and diseased (T1, B2) samples interfaced with the CTSB nanoneedle sensor for 15 min. The yellow fluorescence signal originates from cleaved CTSB substrate. Quantification of the fluorescent signal for single cells shows statistically higher fluorescence for diseased samples (T1, B2). d) Sections of western blot membrane cut at the appropriate molecular weight for pro‐CTSB, CTSB and β‐actin showing protein expression with quantification for matching normal (N3) and diseased (T3) region of tissues from patient 3. Sections are outlined in black. e) Photograph of the margin tissue sample from patient 3 immediately prior to interfacing with nanoneedles. Colored dots identified by letters refer to the approximate position of the confocal microscopy images displayed in panels (g–j). f) Quantification of CTSB activity in the different areas of the sample is shown in (e): tumor region (T, panels g, h), CTSB +ve region at the visible tumor margin (B+), CTSB ‐ve region at the visible tumor margin (B‐) (panels i, j), normal region (N, Figure S6). (g, h) LSCs of the areas indicated in (e): (g, h) within the tumor region (i, j) at the tumor margin. The side views show a regular profile without steep changes in height that could affect interfacing or indicate proximity to the edge of the chip. All LSCs XY views are maximum intensity projections along the Z‐axis, and all XZ and YZ views are single plane sections. ***p < 0.001.
