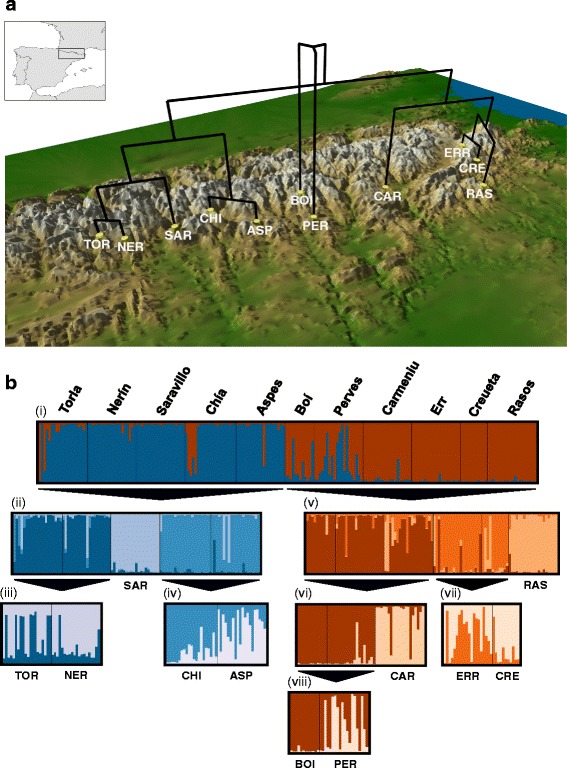
Fig. 2.

Population genetic structure in the Pyrenean Morales grasshopper. Panel a shows sampling sites of the species and phylogenetic relationships among the 11 populations inferred from a neighbor-joining (NJ) tree based on Cavalli-Sforza and Edwards chord distances (D c). The tree was plotted on a topographic map of the Pyrenees using the software GENGIS [ 103 ]. We downloaded topographic data from NASA Shuttle Radar Topographic Mission (SRTM Digital Elevation Data, [73]) as 90 m resolution digital elevation model and subsequently transformed to 30 arc-sec (c. 1 km) resolution for representation. Panel b represents the results of genetic assignment of 202 individuals of the Pyrenean Morales grasshopper based on the Bayesian method implemented in STRUCTURE. We performed hierarchical analyses for subsets of populations considering the most probable K-value inferred at the previous hierarchical level (Additional file 1; Figure S2). Each individual corresponds to a vertical bar partitioned into K-colored segments that represent the individual’s probability of belonging to the cluster with that color. Black lines separate individuals from different populations. Population codes as in Table 1
