
Fig. 5.
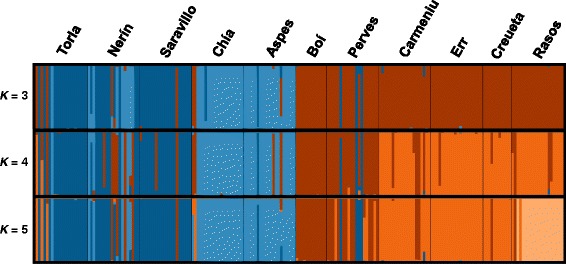
Results of clustering analyses for 202 individuals of the Pyrenean Morales grasshopper for different numbers of genetic clusters (K) based on a discriminant analysis of principal components (DAPC). Each individual corresponds to a vertical bar partitioned into K-colored segments that represent the individual’s probability of belonging to the cluster with that color. Black lines separate individuals from different populations. Cluster colors in K = 4 barplot correspond to those of Fig. 4