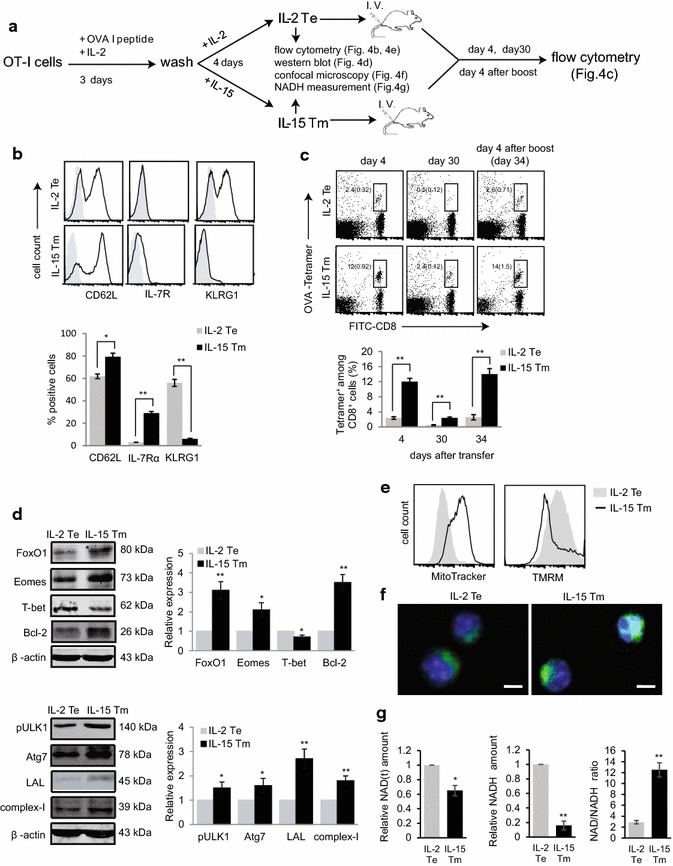
Fig. 4.

In vitro IL-15 signaling converts effector T-cells to memory T-cells with prolonged survival and enhanced memory. a Schematic diagram of the experiment design. b OVAI/IL-2-activated OT-I CD8+ T-cells were restimulated with IL-2 or IL-15, and became IL-2 Te or IL-15 Tm cells. They were stained with Abs, and analyzed by flow cytometry (solid lines). Gray shaded histograms represent isotype Ab controls. The percentages of CD62L, IL-7Rα and KLRG1 positive cells were shown. c IL-2 Te and IL-15 Tm cells (20 × 106) were adoptively transferred into B6 mice (n = 4), and blood samples were collected at day 4, day 30, and day 34 [4 days post DCOVA (1 × 10⁶) boost for recall responses] post T-cell transfer, and analyzed by flow cytometry. The value in each panel represents the percentage of OVA-specific (OVA-tetramer positive) CD8+ T-cells within the total CD8+ T-cell population. d Western blot analysis of IL-2 Te and IL-15 Tm cell lysates using Abs specific for FOXO1, Eomes, T-bet, Bcl-2, pULK1, Atg7, complex-I. Relative expression represents the ratio of the expression of each molecule in IL-15 Tm cells versus that in IL-2 Te cells. e IL-2 Te (gray shaded histograms) and IL-15 Tm cells (solid lines) were stained with MitoTracker and TMRM, and analyzed by flow cytometry for measurement of mitochondrial mass and mitochondrial membrane potential, respectively. f Confocal images show IL-2 Te and IL-15 Tm cells stained with Mitotracker (green) and Hoechst (blue); scale bars represent 5 μm. g NADH amount in IL-2 Te and IL-15 Tm cells. Relative amount of NAD(t) (total NAD+ and NADH) and NADH and NAD/NADH ratio measured in IL-15 Tm cells and in IL-2 Te cells are shown. *p < 0.05, **p < 0.01. One representative experiment of three is shown
