
Figure 5. Impedance measurements across the electrodes at the distances of 200, 400, 600, and 800 μm at different successive time points.
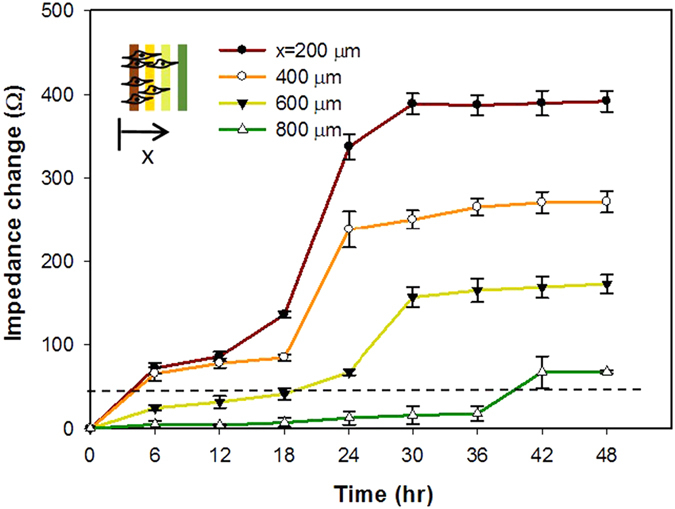
Error bars represent the standard errors of 3 repeated experiments. The dash line represents the impedance change of 32 Ω, i.e., a threshold of certain cells reaching the electrode surface.