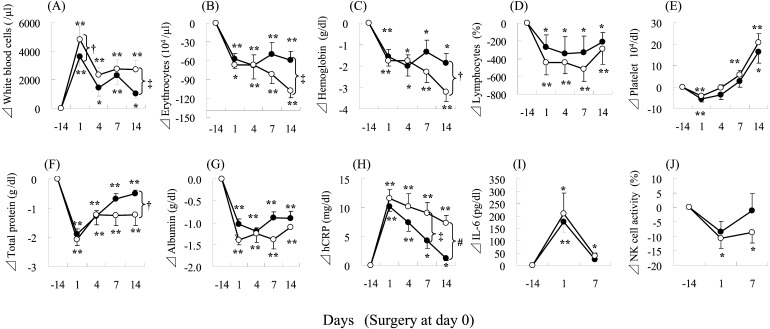
Fig. 3.
Changes in blood parameters during the trial period among patients who received preoperative chemoradiotherapy.
Changes in values, compared with D–14, are shown as means ± SE. ○, control group; ●, probiotic group. *p<0.05, **p<0.01, paired t-test with Bonferroni correction for within-group differences from baseline (D–14). †p<0.1, ‡p<0.05, #p<0.01, Student’s t-test for between-group differences at each time point. (A) white blood cell; (B) erythrocytes; (C) hemoglobin; (D) lymphocytes; (E) platelets; (F) total protein; (G) albumin; (H) high-sensitive C-reactive protein; (I) interleukin-6; (J) natural killer cell activity.

