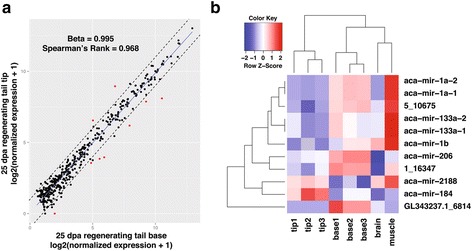
Fig. 2.

Differential expression of microRNAs in the 25 dpa regenerating lizard tail. a: Regression of normalized microRNA expression in the regenerating tail tip and base (Beta-value = 0.995, Spearman’s Rank = 0.968). Each point on the graph represents a microRNA. Dashed lines represent the cutoff for two-fold change. Differentially expressed microRNAs, i.e., displayed significant expression differences as determined by DESeq (adjusted p < 0.05) are represented in red. b: Heatmap of differentially expressed microRNAs. Expression in each replicate is shown. MicroRNAs were clustered by Jensen-Shannon divergence of DESeq variance stabilization transformed expression data
