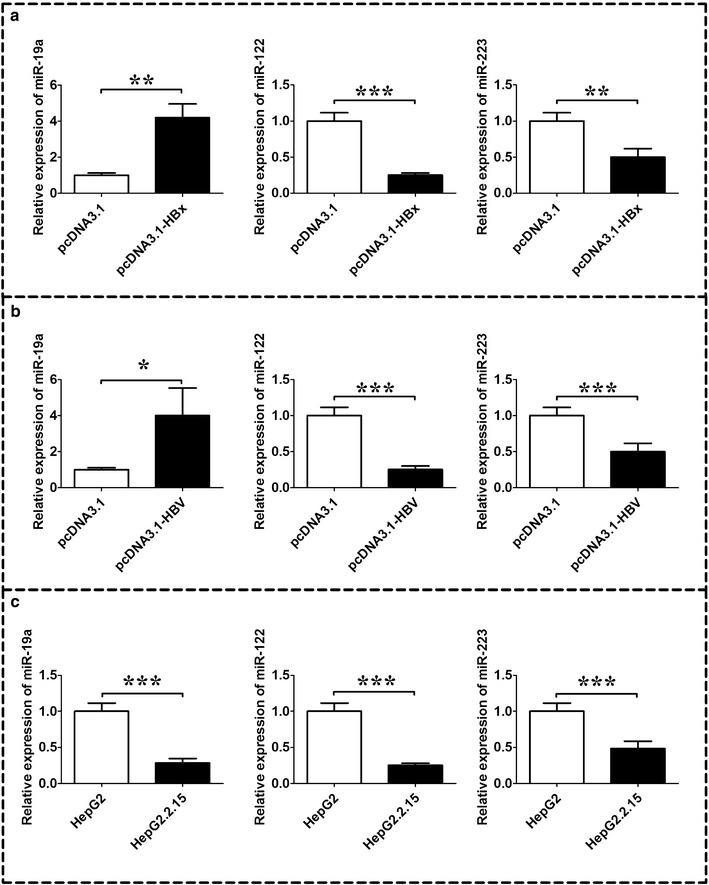
Fig. 2.

Expression levels of miR-19a, miR-122, and miR-223 in HepG2 cells transfected with HBx or HBV and in HepG2.2.15 cells. a qRT-PCR analysis of miR-19a, miR-122, and miR-223 in HepG2 cells transfected with HBx expressing plasmid pcDNA3.1-HBx or its control vector, pcDNA3.1; b qRT-PCR analysis of miR-19a, miR-122, and miR-223 in HepG2 cells transfected with 1.3 fold HBV expressing plasmid pcDNA3.1-HBV or its control vector, pcDNA3.1; c qRT-PCR analysis of miR-19a, miR-122, and miR-223 in HepG2.2.15 cells and its control, HepG2 cell lines. HBV hepatitis B virus, HBx HBV X protein. Data represents the mean ± SEM, n = 3, *P < 0.05; **P < 0.01; ***P < 0.001 (unpaired t-test)
