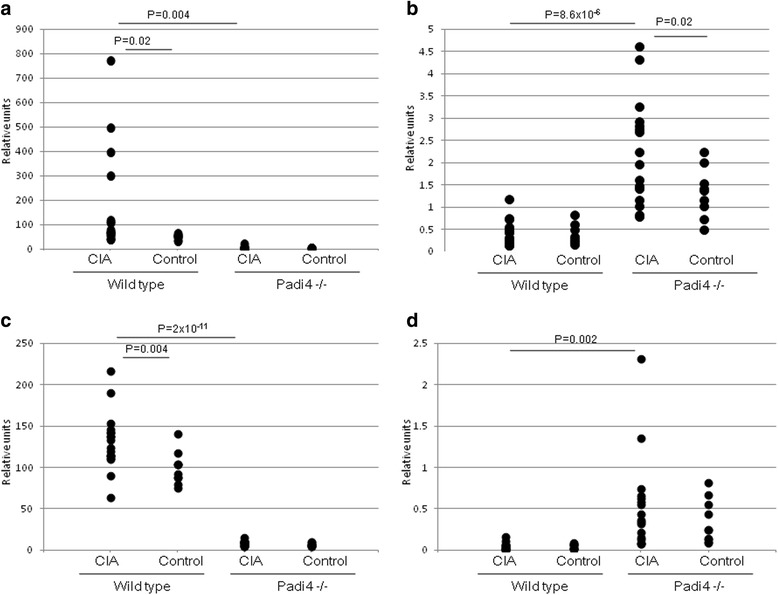
Fig. 3.

Expression of Padi4 and Padi2 genes in CD11b + and Ly-6G+ cells. Wild-type mice with CIA (n = 19), wild-type control mice (n = 10), Padi4−/− mice with CIA (n = 17), and Padi4−/− control mice (n = 10) were used. a Padi4 in CD11b + cells, b Padi2 in CD11b + cells, c Padi4 in Ly-6G+ cells, and d Padi2 in Ly-6G+ cells. Relative units were obtained from the comparative ΔΔCT analysis. Statistical analyses were performed using the Student’s t-test
