
Fig. 2.
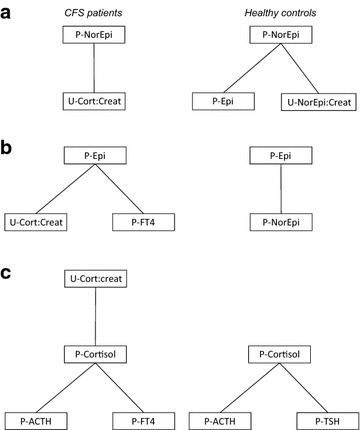
Results of network analyses (single node diagrams) in CFS patients (left) and healthy controls (right). a Plasma norepinephrine as single node. b Plasma epinephrine as single node. c Plasma cortisol as single node. P plasma, U urine, Epi epinephrine, FT4 free thyroxine, ACTH adrenocorticotrophic hormone, TSH thyroid stimulating hormone, NorEpi norepinephrine, Creat creatinine