
Fig. 4.
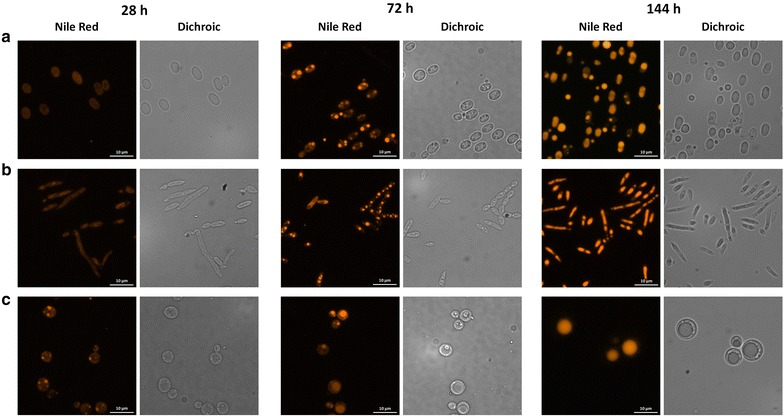
Fluorescence microscope analysis of R. toruloides, C. curvatus and L. starkeyi. R. toruloides (a), C. curvatus (b) and L. starkeyi (c) cells were stained with Nile Red and observed under the microscope after 28, 72, 144 h. For each condition, fluorescence images and the corresponding dichroic image is reported. Since no significant differences in lipid bodies shape and number were observed between samples derived from pure and crude glycerol cultivations, the images here reported refers only to the first condition. Bar indicates 10 μm