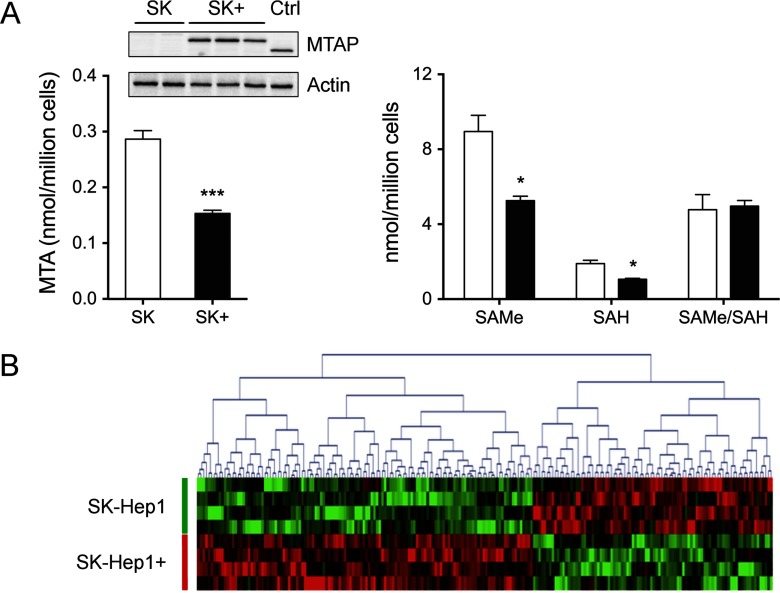
Fig. 1.
One-carbon metabolites and proteome analysis in SK-Hep1+ cells. (A) MTAP, MTA, SAMe, and SAH levels. HepG2 extracts were used as positive control. MTA was down-regulated in MTAP expressing cells while SAMe/SAH ratio remained unchanged. (B) Heat map representing the differential proteins resulting from SK-Hep1 and SK-Hep1+ iTRAQ comparison.

