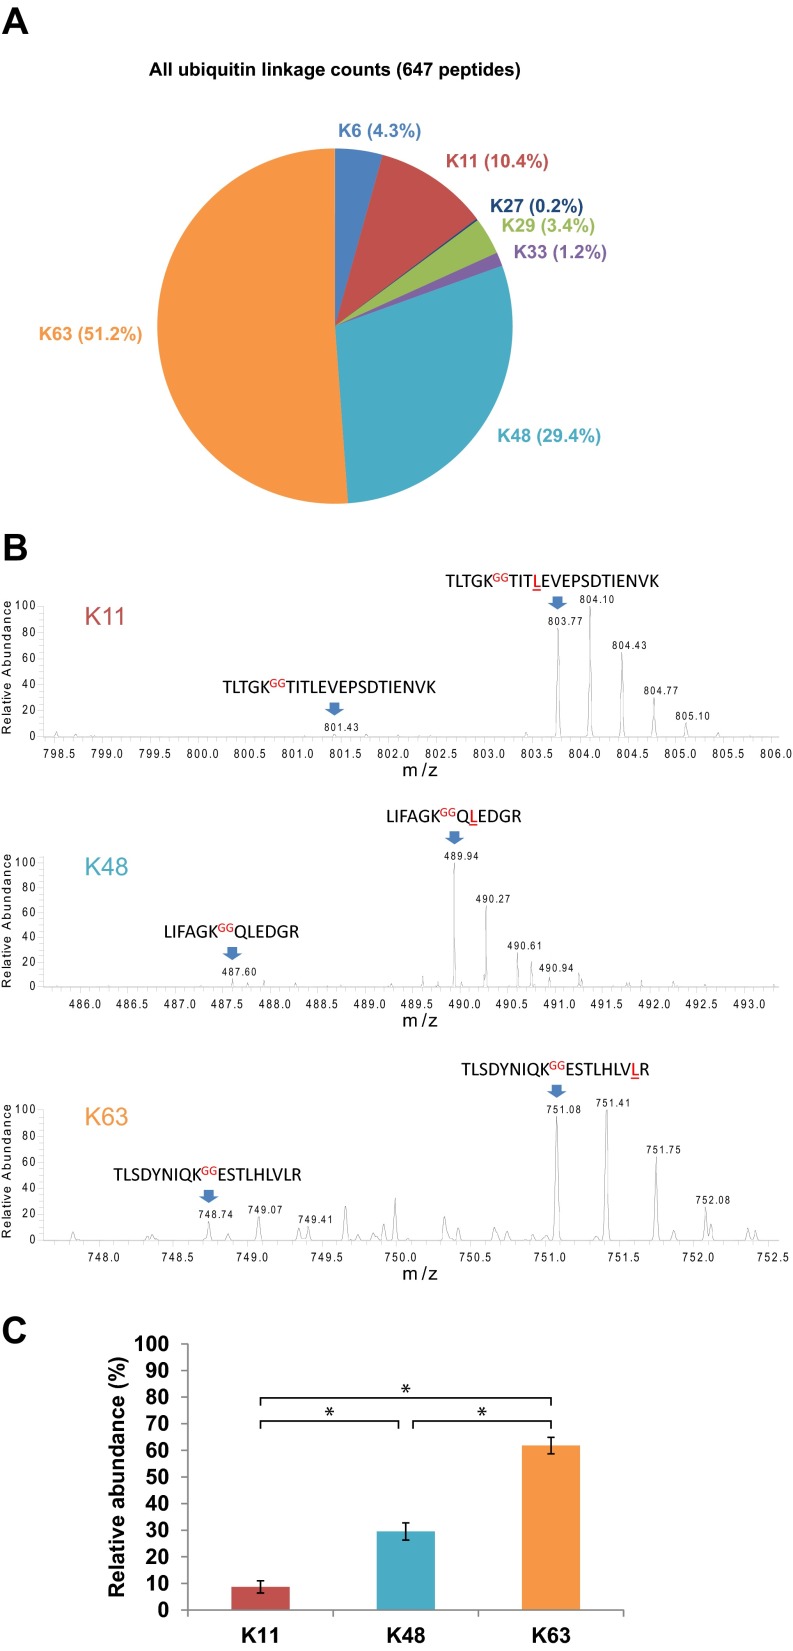
Fig. 6.
Quantification of polyubiquitin chain topologies in human urinary exosomes. (A) Relative abundance of seven polyubiquitin linkages quantified by peptide counting. (B) Representative mass spectra demonstrate relative peak heights of the GG-linked endogenous (light) and AQUA (heavy) peptides of K11-, K48-, and K63-linked polyubiquitin chains. An equal amount (2.5 pmol) of each GG-linked ubiquitin-AQUA peptide was spiked into each sample. (C) Relative abundance of K11, K48, and K63 polyubiquitin chains quantified using the AQUA technique (n = 5). * p < 0.0001 by Tukey's multiple comparison tests.

