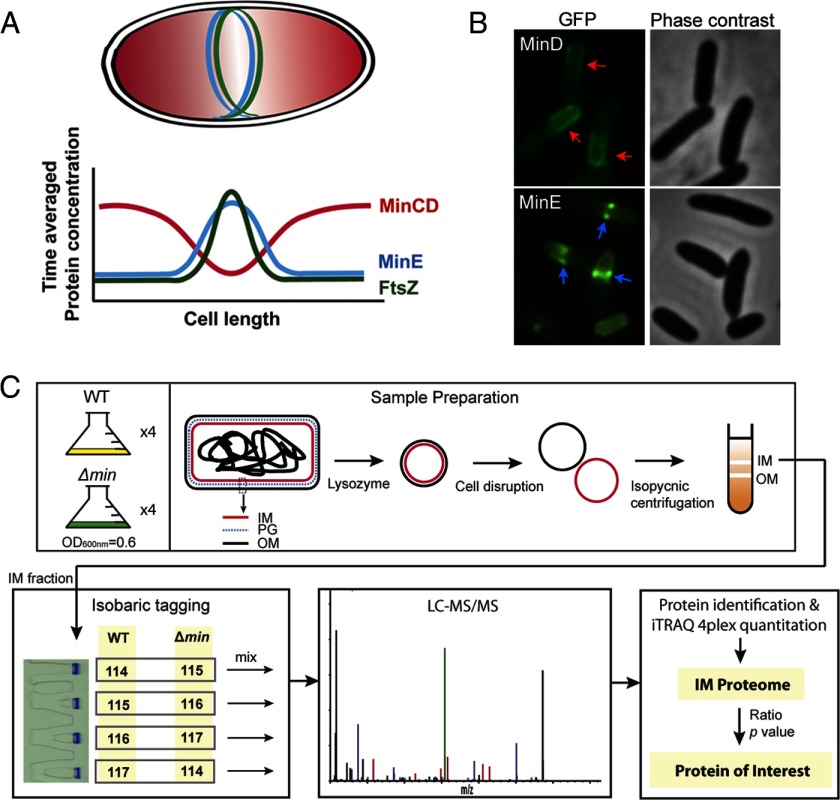
Fig. 1.
Background and experimental procedures of the quantitative proteomic analysis in this work. (A) Pole-to-pole oscillation of the Min proteins establishes a concentration gradient of the division inhibition that is high at the poles (red shade), allowing formation of the FtsZ ring at the midcell. The cyan and green lines indicate the MinE and FtsZ rings, respectively. The chart shows the time-averaged protein concentration along the cell length. The red, cyan, and green lines represent the concentration of MinCD, MinE, and FtsZ, respectively. FtsZ is a tubulin homologue that assembles into a ring structure, the FtsZ ring, to recruit a series of septal proteins to the division site for the formation of the division septum. The FtsZ ring may also contribute constriction forces during cell division. (B) Micrographs showing GFP-MinD localization into a polar zone (red arrow) and MinE-GFP localization into a ring-like structure (blue arrow). (C) Experimental scheme. For clarity, only critical information is shown. The illustration of the intact cell is enlarged and is not in proportion to the size of the IM and OM vesicles.

