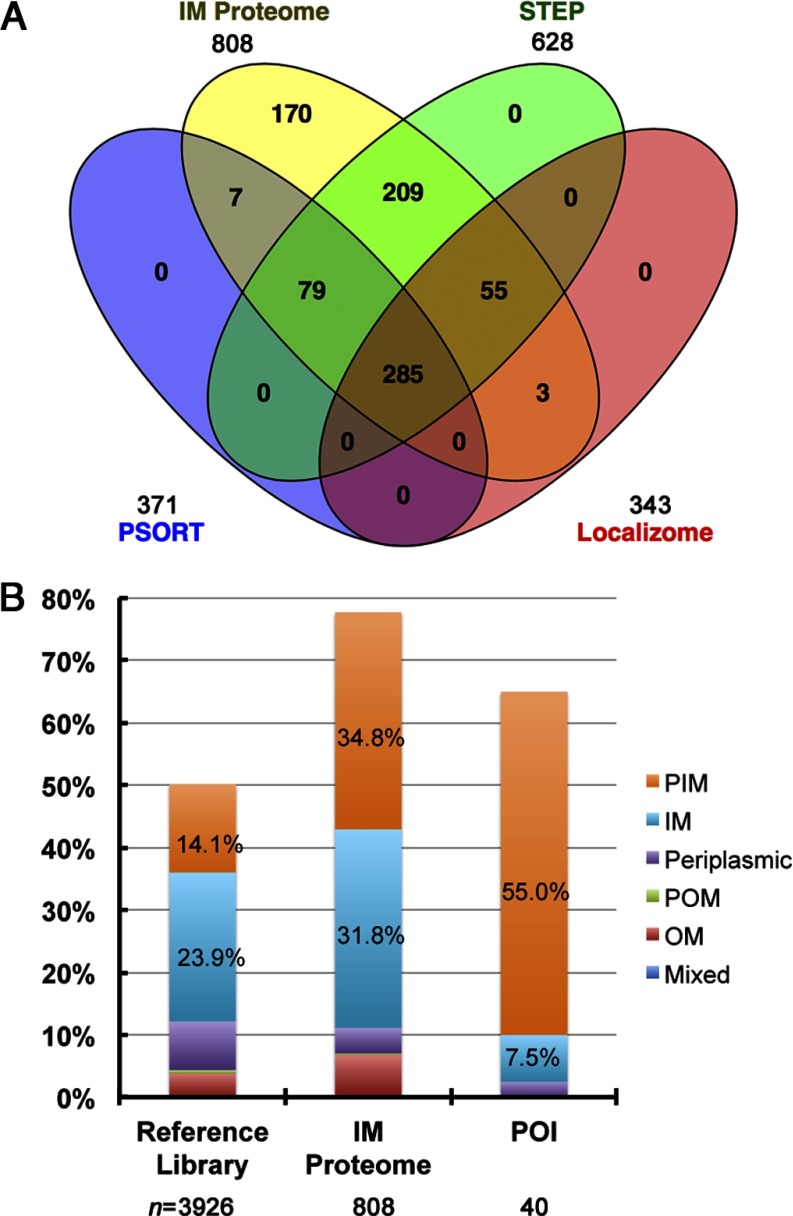
Fig. 2.
Subcellular localization of the IM proteome proteins. (A) A Venn diagram showing coverage of the IM proteome proteins in comparison with the membrane proteins documented in STEPdb, PSORTdb, and Dynamic Localizome. (B) Enrichment of PIM proteins demonstrated by comparison of subcellular localization of membrane proteins in reference library, IM proteome, and POI. The percentage of PIM and IM proteins is labeled in the chart. The number listed below each category is the population size (n).

