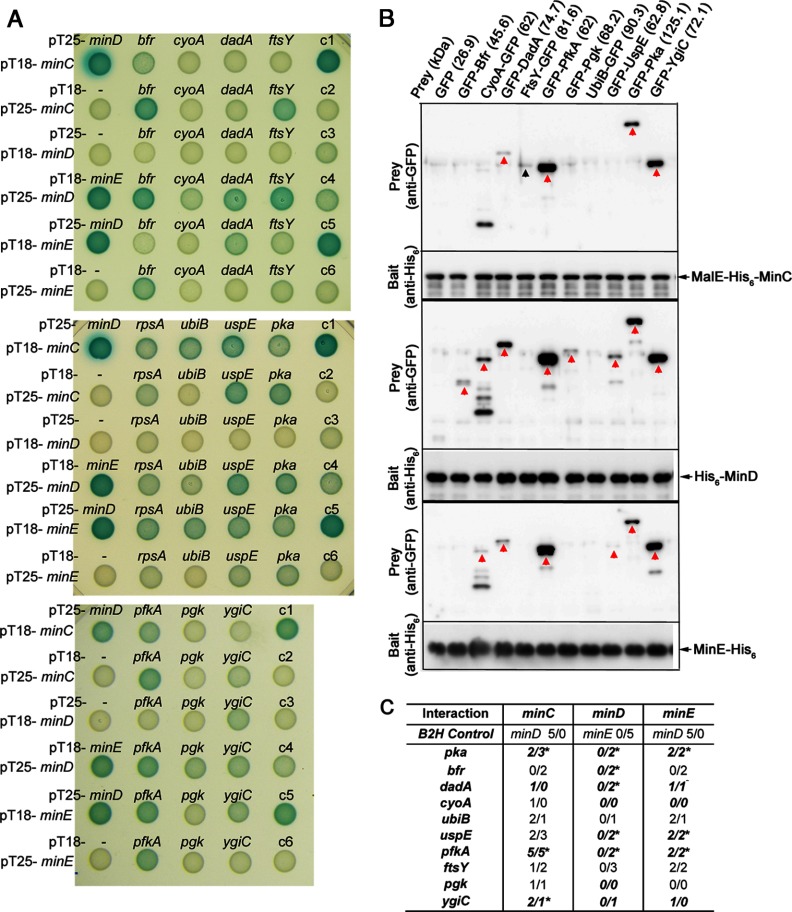
Fig. 4.
Interaction between MinCDE and POIs. (A) Direct interaction examined by the B2H assay. Interaction of minC, minD, and minE with bfr, cyoA, dadA, and ftsY (upper panel), rpsA, ubiB, uspE, and pka (middle panel), and pfkA, pgk, and ygiC (lower panel). RpsA, the 30S ribosomal subunit protein S1 was included as a control. The color was developed at 30 °C for 18 h before taking photographs. Control reactions: c1, pT25-minD/pT18-minE; c2, pT18-minC/pT25; c3, pT25-minD/pT18; c4, pT18-minD/pT25-minD; c5, pT25-minE/pT18-minE; c6, pT18-minE/pT25. (B) Direct interaction examined by the pull-down assay. The His-tagged MinC (top), MinD (middle), and MinE (bottom) were used to pull down the GFP-tagged POIs in the cell lysate. Each set contains two blots. The upper blot was hybridized with the anti-GFP antibody, and the lower blot was hybridized with the anti-His6 antibody. The red arrow indicates the signal detected at the expected molecular weight. The black arrow indicates the signal that was not at the expected molecular weight. (C) A summary of the interaction between MinCDE and POIs. The images were converted to 8-bit and the intensity of the colony was measured using ImageJ. The measurements were subtracted by the intensity of the corresponding negative control in each set of measurements. The scores represent the strength of intensity that was determined by the ratio of intensity between the examined pair of interaction and the positive control. The scoring criteria are as follows: 5—positive control as 100%; 4—greater than 50%; 3—30 to 50%; 2—10 to 30%; 1—less than 10% and regarded as the background. The two numbers are the scores of minC, minD, or minE when cloned in pT18 and pT25 for cross-examination. The interactions detected in the pull-down assays were shown in italics, bold letters. The asterisks indicated the reproducible interactions in both assays.

