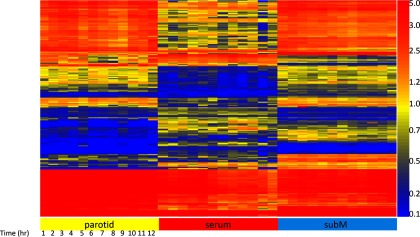
Fig. 1.
Analysis of serum and saliva taken from parotid and submandibular glands. This heatmap shows 3000 peptides out of 10,000 on the microarray that survived an ANOVA1 testing for differences between samples taken from Volunteer #1: saliva/submandibular, saliva/parotid, and serum, with p < 1.07 × 10⁻¹⁷. The Y-axis shows each of the 3000 peptides ordered by Euclidean distance. The X-axis shows each 1-h time point taken over 12 consecutive hours, ordered left to right. These 3000 peptides differentiate blood and saliva by the reactivity of antibodies that appear in blood versus those that appear in saliva. The average precision across technical replicates is r = 0.917 Pearson's correlation coefficient. Data shown are the average of two replicates.

