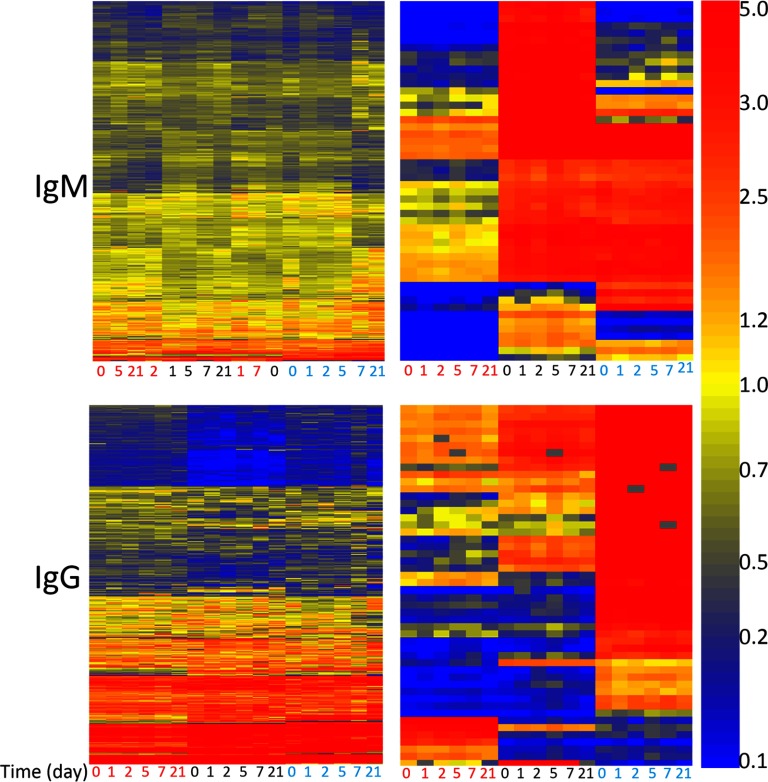
Fig. 2.
Heatmaps depicting IgG or IgM response in three different healthy persons (Volunteer #2, Volunteer #3, Volunteer #5) over the course of 21 days. IgM was detected with affinity-purified anti-human IgM antibody conjugated to red (647 nm) dye, IgG was detected with affinity-purified anti-human IgG antibody conjugated to green (555 nm) dye. X-axis is the day of donation of serum. Person 1 is labeled with red text, person 2 is labeled with black text, person 3 is labeled with cyan text. Clustering of the X-axis and Y-axis were done using Euclidean distance. The left heatmaps show all 10,000 peptides. Clustering of IgM signals shows little distinction per person or per day. Clustering of IgG signals shows more specificity across persons, and within each person signals order themselves by day of donation. Right heatmaps: 50 peptides were selected by ANOVA, p < 5.02 × 10⁻¹⁸ for IgM and p < 9.01 × 10−36 for IgG. At this cutoff, exactly 50 peptides pass the cutoff. Sequences are listed in Supplemental Table S1.

