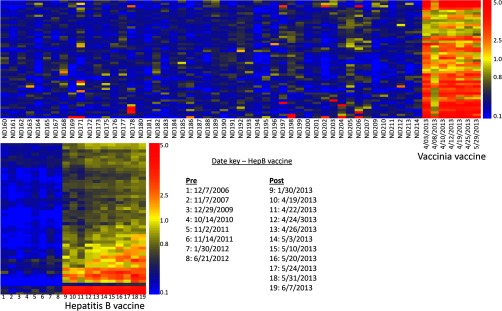
Fig. 5.
Immunosignature of vaccines. Two different comparisons are shown. Top heatmap depicts 50 different healthy volunteers who donated blood once are compared with a single laboratory worker, Volunteer #5, who received the Vaccinia vaccine on Mar. 23, 2013 as part of his or her research program, and 50 peptides selected by comparing postvaccine samples to healthy donors using a t test (p < 3.03 × 10−38). Seven postvaccine time points were taken, with dates shown on the X-axis. Bottom heatmap represents Volunteer #6 who received a three-dose hepatitis B vaccine on Jan. 25, 2013 with a boost on Apr. 23, 2013 and July 15, 2013. Prevaccine time points were collected from previous years and listed to the right of the heatmap. A t test between pre- and postvaccine samples yielded 50 peptides with p < 9.41 × 10⁻²⁸ that define the hepatitis B vaccine signature. No samples drawn after the third boost.

