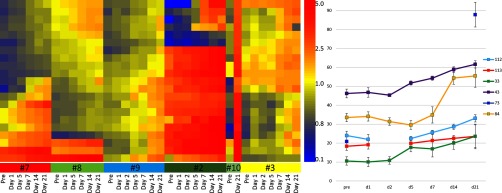
Fig. 7.
Heatmap of a time course for Volunteer #3 across 32 days in 2013 (Nov. 9, 2013 to Dec. 10, 2013) and across the years 2008 to 2012 (the last 2 days were excluded). Left: Volunteer #3 received the 2013 seasonal influenza vaccine (A/California/7/2009, A/Victoria/361/2011, and B/Massachusetts/2/2012) on Nov. 17, 2013. Without using information about the date of immunization, 22 peptides were selected that changed intensity for at least 2 days consecutively, either up or down (Y-axis). The X-axis is an ordered list of immunosignatures from Volunteer #3 for 30 consecutive days (left part of heatmap) and also once per year for 5 years (right part of heatmap). Right: sum of the intensities for all 22 peptides displayed in a line graph. Error bars represent the upper and lower 95% CI.

